3 Key Metrics to Evaluate Market Valuation
Suspect the market is overvalued? There are many indicators that investors track to gauge market valuation. Below are three main ones to consider:
1) Price-to-Earnings Ratio (P/E)
January 2025 Takeaway: Market looks very highly valued based on P/E.
P/E is a quick way to gauge the valuation of individual companies as well as the market overall. The S&P 500’s trailing 12-month P/E multiple is estimated to be 30.5 as of late January 2025. Over the last ten years the average S&P 500 P/E multiple has been closer to 23. The low point during the last twenty years was a P/E of 13.5 in August 2011. Those two figures make it quite clear that today’s 30.5 P/E multiple is a noteworthy outlier. If we ignore the post-crisis spikes in P/E caused by declines in earnings during the early 2000s recession, the 2008-09 financial crisis and the 2020 Covid pandemic, the current P/E of 30.5 is only surpassed by the 1998-1999 dot com bubble where the peak value of P/E was 34 in March 1999.
S&P 500 P/E Multiple
Based on Trailing 12M Earnings
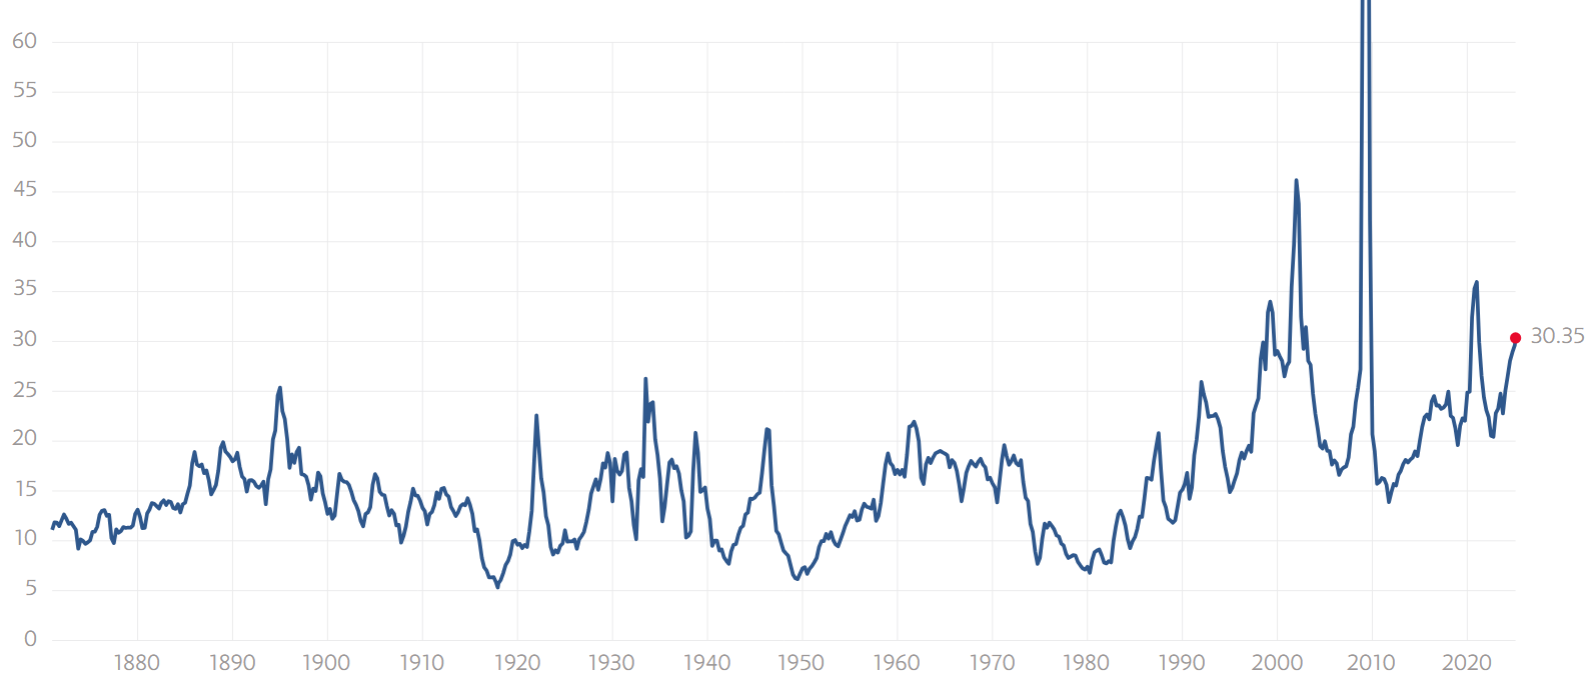
Chart Source: Multpl.com S&P 500 PE Ratio
2) Earnings Yield (E/P) Compared to Risk-Free Rate
January 2025 Takeaway: Market looks overvalued based on E/P compared to risk-free rate.
Flipping the P/E ratio implies calculating earnings divided by price which gives you earnings yield. Earnings yield makes the price of a stock or an index more directly comparable to a bond yield. The risk-free rate, represented by the 10Y US Treasury, is yielding 4.6% (January 2025). The S&P 500 earnings yield is 3.3% on a trailing 12M basis and 4.1% on a forward basis. Both of these are clearly below the risk-free rate implying a negative equity risk premium! That’s not sustainable forever. Investors should be getting a premium over the risk-free rate for holding risk assets such as equities. The equity risk premium should hypothetically be closer to 2-4% to compensate for the risks associated with equities; however, for the last 30 years the S&P 500 ERP has averaged a mere 0.74%. In the last 20 years the average ERP has been 1.74%.
S&P 500 Equity Risk Premium (ERP) 1995-2025
ERP = Earnings Yield – US 10Y Treasury
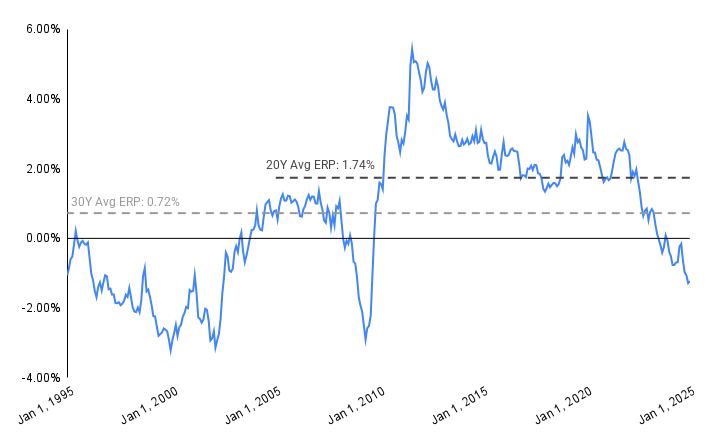
Chart Source: Trefis with data from Multpl
Today’s negative equity risk premium implies that one or more of these events need to happen going forward:
(a) the risk-free rate will decline allowing the S&P 500’s current valuation to grow into a positive equity risk premium, or
(b) S&P 500 earnings will grow even faster than expected thereby increasing earnings yield , or
(c) S&P 500 price level will decline or stagnate such that a positive equity risk premium is eventually achieved
Some combination of multiple of these events is the likely outcome. As of January 2025, there are multiple rate cuts expected for 2025 implying that the risk-free rate will indeed decline.
3) Earnings Growth vs. Market Return
January 2025 Takeaway: Market returns have overshot earnings growth over the last 12 months.
FactSet Insight provides commentary on the state of the market. Their January 24, 2025 update shows the S&P 500’s increase in price has outpaced the increase in 12-month forward S&P 500 earnings per share (EPS) since late 2023. Over the long-run (decades) the S&P 500’s price level is closely correlated with increases in earnings from the S&P 500 constituents. However, in the short-term there can be localized deviations from this trend.
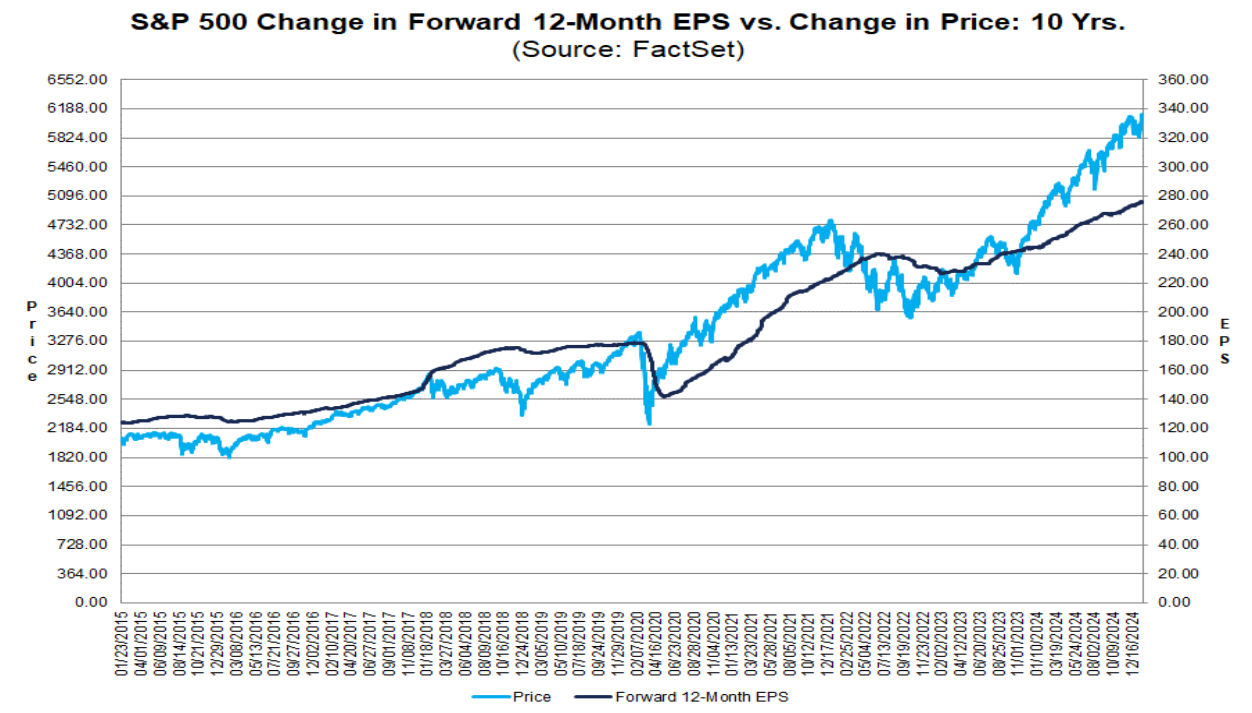
Chart Source: FactSet Insights January 24, 2025
Even More Indicators
If you’re looking for more, Current Market Valuation has examples of additional indicators that investors track to gauge the market.