Walmart US Region Continues To Push Top Line Growth
Walmart (NYSE: WMT), whose stock is currently trading at around $118, generates its revenue from its Stores operating across the US and other countries. In this note we discuss the historical performance, and expected Total Revenue for FY 2019. You can look at our interactive dashboard analysis ~ Walmart Revenue: How does Walmart make money? ~ for more details. In addition, here is more Multiline Retail data.
Walmart’s Business Model:
- Up 32% Since Beginning of This Year, Will Walmart’s Strong Run Continue Following Q2 Results?
- Up 15% This Year, Will Walmart Stock Rally Further After Q1 Results?
- Where Is Walmart Stock Headed Post Stock Split?
- Up 7% Already This Year , Where Is Walmart Stock Headed Post Q4 Results?
- Up 18% This Year, Will Walmart Stock Continue To Grow Past Q3?
- Can Walmart’s Stock Trade Lower Post Q2?
What Does Walmart offer?
- Walmart Inc. provides customers an opportunity to shop in retail stores and through eCommerce. Each week, they serve nearly 275 million customers through their 11,300+ stores and eCommerce websites in 27 countries. As per the company, their strategy is to make every day easier for busy families, operate with discipline, sharpen their culture and become digital, and make trust a competitive advantage.
Has 3 major Operating segments:
- Walmart U.S.: Walmart U.S. is the largest segment and operates in the U.S., including in all 50 states, Washington D.C., and Puerto Rico. Walmart U.S. is a mass merchandiser of consumer products, operating under the “Walmart” and “Walmart Neighborhood Market” brands, as well as walmart.com, jet.com, and other eCommerce brands.
- Walmart International: Walmart International is the second largest segment and operates in 26 countries outside of the U.S. Walmart International operations includes numerous formats divided into three major categories: retail, wholesale, and other. These categories consist of many formats, including: supercenters, supermarkets, hypermarkets, warehouse clubs (including Sam’s Clubs), and cash & carry, as well as eCommerce through walmart.com.mx, asda.com, walmart.ca, flipkart.com, and other sites.
- Sam’s Club: Sam’s Club operates in 44 states in the U.S. and in Puerto Rico. Sam’s Club is a membership-only warehouse club that also operates samsclub.com.
What Are The Alternatives?
- Major competitors are companies like Best Buy, Bed Bath & Beyond, Target, and Costco.
What Is The Basis of Competition?
- The competition is in a variety of ways, including the prices at which they sell the merchandise, merchandise selection and availability, services offered to customers, location, store hours, in-store amenities, the shopping convenience and overall shopping experience, the attractiveness and ease of use of digital platforms, cost and speed of and options for delivery to customers of merchandise purchased through digital platforms or through omni-channel integration of physical and digital operations.
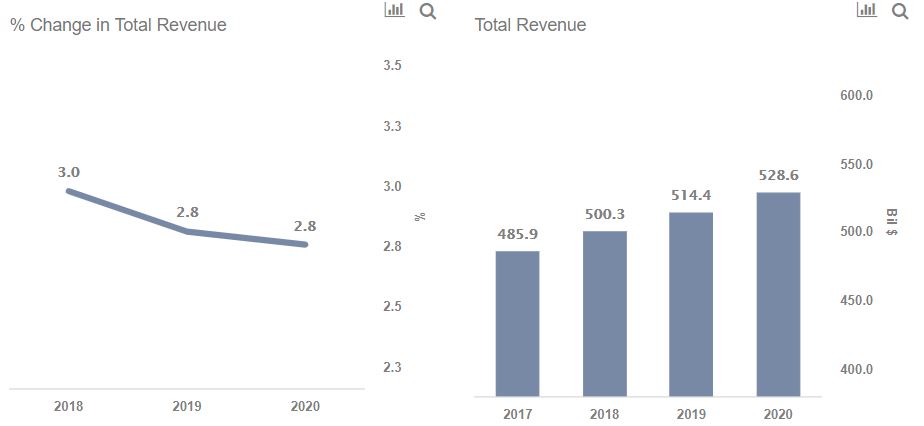
Walmart’s Total Revenue has increased by 5.9% between 2017 and 2019, and is expected to increase further by 2.8% in 2020
- Total Revenue has seen continuous growth over the years as it increased from $485.9 billion in FY 2017 to $514.4 billion in FY 2019 which translates to a growth of 5.9% for the overall period.
- Trefis estimates revenue to grow by a further 2.8% in FY 2020 and reach around $528.6 billion for FY 2020 (ended January 2020).
Walmart Revenue continues on a steady growth path – for further details regarding its divisions please check Walmart Revenues:
- Walmart US Revenue has increased by 7.7% between 2017 and 2019, and is expected to increase further by 3.7% in 2020.
-
Walmart International Revenue has increased by 4.1% between 2017 and 2019, and is expected to increase further by 0.3% in 2020.
-
Sam’s Club Revenue has increased by 0.8% between 2017 and 2019, and is expected to increase further by 2.4% in 2020.
For CFOs and Finance Teams | Product, R&D, and Marketing Teams
Like our charts? Explore example interactive dashboards and create your own

