How Will Science Applications International Stock React To Upcoming Earnings?

Science Applications International Corp (NASDAQ:SAIC) a major technology integrator that provides engineering, IT, and mission solutions to government and commercial customers, is expected to report its Q4 FY’25 results on March 17. The consensus forecast is for earnings of $2.09 per share, up from $1.43 in the year-ago period, while revenues are estimated at $1.81 billion, up 4% compared to last year. Growth is likely to be driven by a potential ramp-up in volumes on existing and new contracts, although this could be partially offset by contract completions. The company has $5.2 Bil in current market capitalization. Revenue over the last twelve months was $7.4 billion, and it was operationally profitable with $505 million in operating profits and a net income of $303 million. SAIC stock has corrected by over 30% since November 2024, following the election of President Donald Trump, which resulted in concerns about the outlook for federal spending. Now, how is the stock likely to react post-Q4 earnings? While a lot will depend on how results stack up against consensus and expectations, understanding historical patterns might just turn the odds in your favor if you are an event-driven trader.
There are two ways to do that: understand the historical odds and position yourself prior to the earnings release, or look at the correlation between immediate and medium-term returns post earnings and position yourself accordingly after the earnings are released. That said, if you seek upside with lower volatility than individual stocks, the Trefis High-Quality portfolio presents an alternative – having outperformed the S&P 500 and generated returns exceeding 91% since its inception.
See the earnings reaction history of all stocks
Science Applications International’s Historical Odds Of Positive Post-Earnings Return
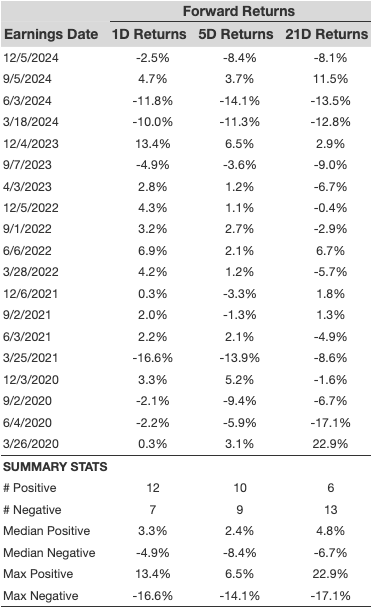
Some observations on one-day (1D) post-earnings returns:
- There are 19 earnings data points recorded over the last five years, with 12 positive and 7 negative one-day (1D) returns observed. In summary, positive 1D returns were seen about 63% of the time.
- Notably, this percentage increases to 64% if we consider data for the last 3 years instead of 5.
- Median of the 12 positive returns = 3.3%, and median of the 7 negative returns =-4.9%
Additional data for observed 5-Day (5D), and 21-Day (21D) returns post earnings are summarized along with the statistics in the table below.
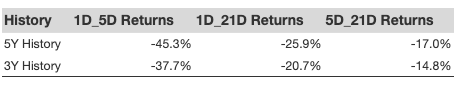
Correlation Between 1D, 5D, and 21D Historical Returns
A relatively less risky strategy (though not useful if the correlation is low) is to understand the correlation between short-term and medium-term returns post-earnings, find a pair that has the highest correlation, and execute the appropriate trade. For example, if 1D and 5D show the highest correlation, a trader can position themselves “long” for the next 5 days if the 1D post-earnings return is positive. Here is some correlation data based on a 5-year and 3-year (more recent) history. Note that the correlation 1D_5D refers to the correlation between 1D post-earnings returns and subsequent 5D returns.
Learn more about Trefis RV strategy that has outperformed its all-cap stocks benchmark (combination of all 3, the S&P 500, S&P mid-cap, and Russell 2000), to produce strong returns for investors. Separately, if you want upside with a smoother ride than an individual stock like Science Applications International, consider the High Quality portfolio, which has outperformed the S&P and clocked >91% returns since inception.
| Returns | Mar 2025 MTD [1] |
2025 YTD [1] |
2017-25 Total [2] |
| SAIC Return | 6% | -6% | 40% |
| S&P 500 Return | -7% | -6% | 147% |
| Trefis Reinforced Value Portfolio | -6% | -8% | 600% |
[1] Returns as of 3/14/2025
[2] Cumulative total returns since the end of 2016
Invest with Trefis Market-Beating Portfolios
See all Trefis Price Estimates