How Will Range Resources Stock React To Its Upcoming Earnings?

Range Resources Corporation (NYSE: RRC), a natural gas exploration and production company, is set to report its fiscal first-quarter earnings on Tuesday, April 22, 2025. Analysts predict the company will report earnings of $0.89 per share on $808 million in sales. This would represent over 2x growth in earnings and a 25% growth in sales compared to the previous year’s figures of $0.38 per share and $645 million, respectively. Historically, the stock has increased following earnings 50% of the time, with a median one-day rise of 2.3% and a maximum growth of 9%.
With rising demand for natural gas driven by LNG exports, power generation, and AI, investors will closely watch the results. The colder-than-expected winter of 2024–25 has significantly drawn down natural gas storage levels, tightening supply and contributing to a more bullish price outlook. This shift in market dynamics serves as a strong tailwind for Range Resources, positioning the company to benefit from elevated natural gas prices. Furthermore, with natural gas demand from data centers projected to quadruple by 2030, particularly in the Northeastern United States, RRC is strategically located and operationally prepared to capitalize on this substantial growth opportunity. The company has $8 Bil in current market capitalization. Revenue over the last twelve months was $2.4 Bil, and it was operationally profitable with $251 Mil in operating profits and net income of $266 Mil. While a lot will depend on how results stack up against consensus and expectations, understanding historical patterns might turn the odds in your favor if you are an event-driven trader.
For event-driven traders, historical patterns may offer an edge, whether by positioning ahead of earnings or reacting to post-release moves. That said, if you seek upside with lower volatility than individual stocks, the Trefis High-Quality portfolio presents an alternative, having outperformed the S&P 500 and generated returns exceeding 91% since its inception. See earnings reaction history of all stocks.

Range Resources’ Historical Odds Of Positive Post-Earnings Return
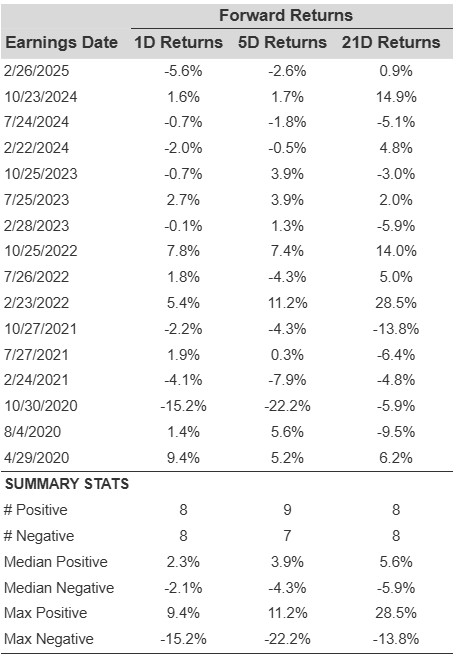
Some observations on one-day (1D) post-earnings returns:
- There are 16 earnings data points recorded over the last five years, with 8 positive and 8 negative one-day (1D) returns observed. In summary, positive 1D returns were seen about 50% of the time.
- However, this percentage decreases to 44% if we consider data for the last 3 years instead of 5.
- Median of the 8 positive returns = 2.3%, and median of the 8 negative returns = -2.1%
Additional data for observed 5-Day (5D), and 21-Day (21D) returns post earnings are summarized along with the statistics in the table below.
Correlation Between 1D, 5D, and 21D Historical Returns
A relatively less risky strategy (though not useful if the correlation is low) is to understand the correlation between short-term and medium-term returns post earnings, find a pair that has the highest correlation, and execute the appropriate trade. For example, if 1D and 5D show the highest correlation, a trader can position themselves “long” for the next 5 days if 1D post-earnings return is positive. Here is some correlation data based on 5-year and 3-year (more recent) history. Note that the correlation 1D_5D refers to the correlation between 1D post-earnings returns and subsequent 5D returns.

RRC Correlation Between 1D, 5D and 21D Historical Returns
Learn more about Trefis RV strategy that has outperformed its all-cap stocks benchmark (combination of all 3, the S&P 500, S&P mid-cap, and Russell 2000), to produce strong returns for investors.
Invest with Trefis Market-Beating Portfolios