How Will Roku Stock React To Its Upcoming Earnings?

Roku (NASDAQ:ROKU) is set to report its Q1 2025 earnings around May 1, reporting on a quarter that is likely to see the company continue to benefit from a rising user base and higher advertising sales. Revenues are projected to grow by about 14% year-over-year to $1.01 billion, per consensus estimates, while losses are likely to come in at -$0.25 per share, slightly better than last year.
Roku reported that it had a total of 90 million subscribers in early January, reflecting a roughly 12.5% year-over-year growth. This is likely to help the company boost the platform business, which sells digital video subscriptions and advertisements on Roku devices. Roku’s stronger engagement could also help it drive advertising sales. In Q4, streaming hours touched 34 billion, up 18% year-over-year.
Roku has $8.5 billion in current market capitalization. Revenue over the last twelve months was $4.1 billion, and it was operationally loss-making with $-218 million in operating losses and net income of $-129 million. That said, if you seek upside with lower volatility than individual stocks, the Trefis High-Quality portfolio presents an alternative, having outperformed the S&P 500 and generated returns exceeding 91% since its inception.
See earnings reaction history of all stocks
Roku’s Historical Odds Of Positive Post-Earnings Return
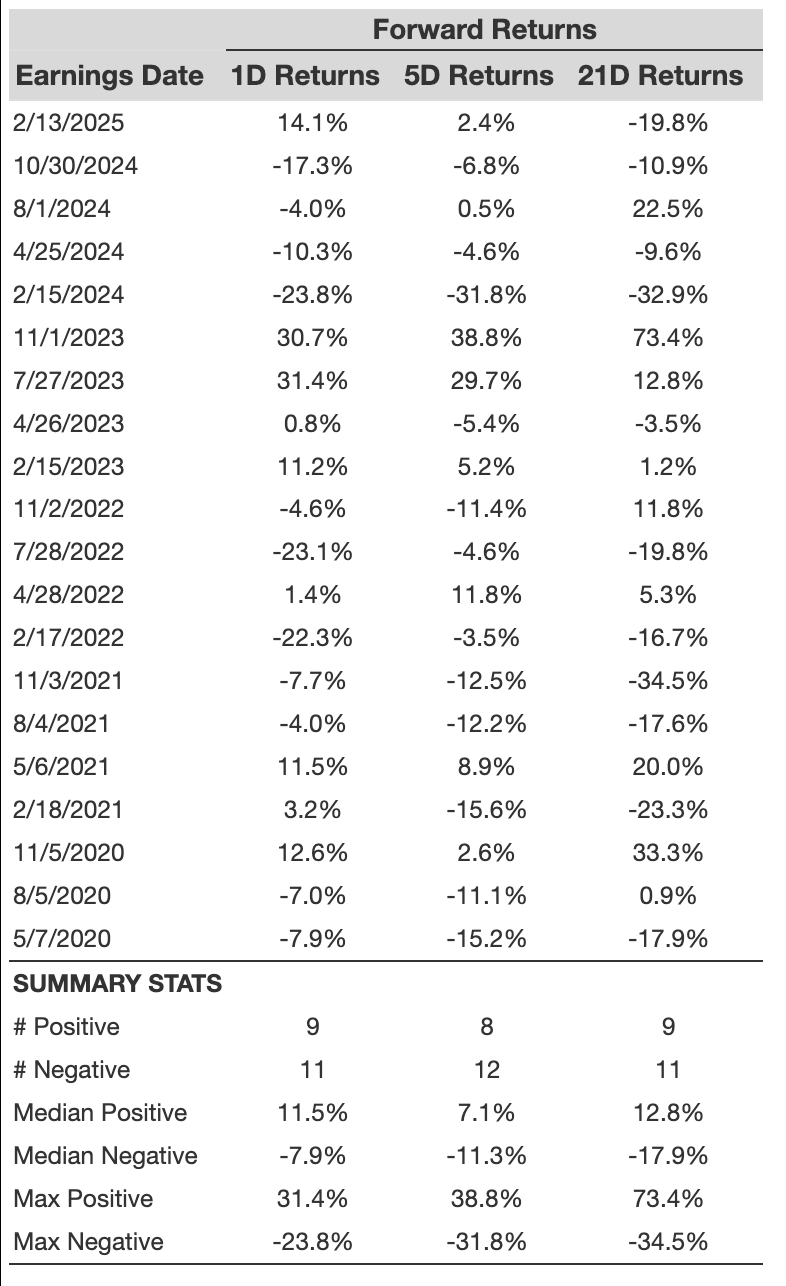
Some observations on one-day (1D) post-earnings returns:
- There are 20 earnings data points recorded over the last five years, with 9 positive and 11 negative one-day (1D) returns observed. In summary, positive 1D returns were seen about 45% of the time.
- Notably, this percentage increases to 50% if we consider data for the last 3 years instead of 5.
- Median of the 9 positive returns = 12%, and median of the 11 negative returns = -7.9%
Additional data for observed 5-Day (5D) and 21-Day (21D) returns post earnings are summarized along with the statistics in the table below.
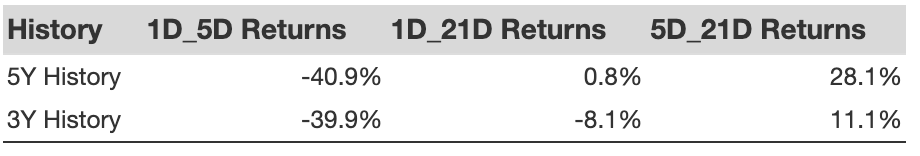
Correlation Between 1D, 5D, and 21D Historical Returns
A relatively less risky strategy (though not useful if the correlation is low) is to understand the correlation between short-term and medium-term returns post earnings, find a pair that has the highest correlation, and execute the appropriate trade. For example, if 1D and 5D show the highest correlation, a trader can position themselves “long” for the next 5 days if the 1D post-earnings return is positive. Here is some correlation data based on a 5-year and 3-year (more recent) history. Note that the correlation 1D_5D refers to the correlation between 1D post-earnings returns and subsequent 5D returns.
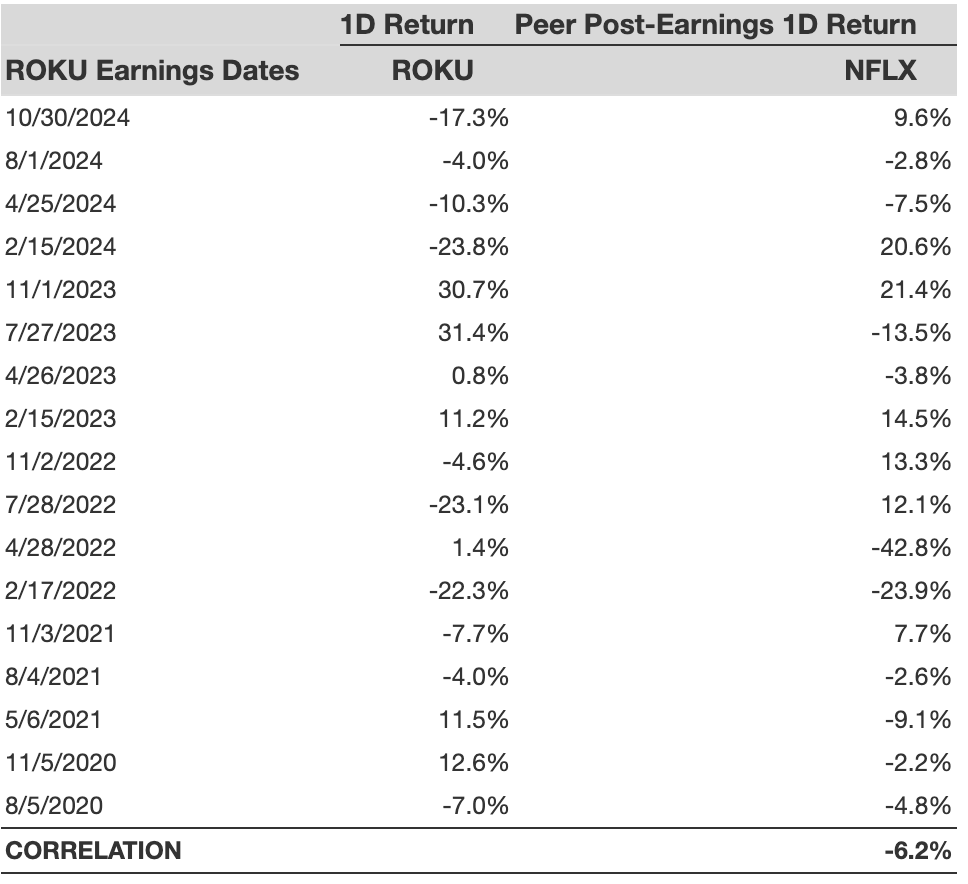
Is There Any Correlation With Peer Earnings?
Sometimes, peer performance can have an influence on post-earnings stock reaction. In fact, the pricing-in might begin before the earnings are announced. Here is some historical data on the past post-earnings performance of Roku stock compared with the stock performance of peers that reported earnings just before Roku. For fair comparison, peer stock returns also represent post-earnings one-day (1D) returns.
Learn more about Trefis RV strategy that has outperformed its all-cap stocks benchmark (combination of all 3, the S&P 500, S&P mid-cap, and Russell 2000), to produce strong returns for investors. Separately, if you want upside with a smoother ride than an individual stock like Roku, consider the High Quality portfolio, which has outperformed the S&P and clocked >91% returns since inception.
Invest with Trefis Market-Beating Portfolios
See all Trefis Price Estimates