Key Takeaways and Trends From Revlon’s Q2 FY’18 Earnings
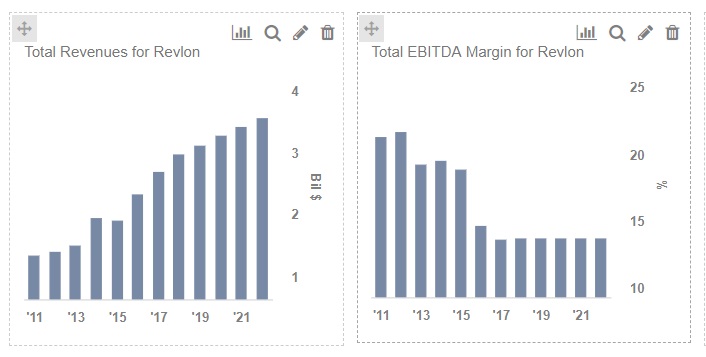
Revlon (NYSE: REV) reported its Q2 earnings on Aug 9, where its top line declined to $606.8 million, down 6% y-o-y basis in Q2, primarily driven by net sales declines in the Revlon, Portfolio, and Fragrances segments, with a slight offset by net sales growth within the Elizabeth Arden segment. Revlon has also experienced this decline in net sales due to service level disruptions at the Company’s Oxford, N.C. plant.
Revlon’s Elizabeth Arden brand has performed well in Q2 driven by new launches and a strong digital presence. Its net sales rose 4.9% to $106.1M, primarily driven by higher net sales of Elizabeth Arden skin care products, including Ceramide and Prevage, principally in international markets. Revlon is on track to attain integration synergies of $190 million by 2020 in restructuring and related charges in connection with implementing actions under the Elizabeth Arden Integration Program in Q2.
With the initiatives adapted by Revlon’s top management for a brand makeover, the company is positive that the new changes will now steer Revlon towards the path of growth in Q3 and beyond. Please refer to our dashboard Key Takeaways From Revlon Q2 Earnings.
- Key Takeaways and Trends from Revlon’s Q4 Earnings Release
- What Was The Most Important Revenue Driver For Revlon Over The Last 3 Years?
- What Is the Fundamental Value of Revlon Based On Expected 2019 Results?
- Key Takeaways and Trends from Revlon’s Q3 Earnings Release
- How Will Revlon Perform In Q3 2018 Earnings
- What Are Revlon’s Key Sources Of Revenue?

Key trends from Revlon’s Second quarter 2018 earnings are outlined below:
Segment-wise performance in Q2 – Effective January 1, 2018, Revlon began to operate under four global brand teams reporting its results under four new segments: Revlon, Elizabeth Arden, Portfolio brands, and Fragrances.
Net sales for the Revlon segment decreased by 10.8% y-o-y to $258.3 million, driven by a downturn in the net sales of Revlon color cosmetics and Revlon ColorSilk hair color due to the impact of service level disruptions at the Company’s Oxford, N.C. manufacturing facility and consumption declines in North America. Elizabeth Arden net sales, on the other hand, increased by 4.9% on a y-o-y basis to $106 million compared to the prior-year period, driven by an increase in net sales of Elizabeth Arden branded skin care products internationally.
Professional segment net sales decreased by 2.9% y-o-y in Q2 to $147.6 million due to weakness in net sales of American Crew men’s grooming products and Cutex nail care. Whereas Fragrances segment net sales decreased by 15% to $94.8 million y-o-y driven by the loss of certain licenses in 2018 and decrease in net sales of designer fragrances, including Juicy Couture and John Varvatos.
Decline in International Markets – Total International Sales of the company saw a y-o-y decrease of 6% in Q2 driven by a decline in sales of Revlon (14.9%), Portfolio (16.5%) and Fragrance segments (25.3%). On the other hand, Elizabeth Arden segment’s International net sales of $79.1 million in the second quarter of 2018 increased by 9.9% compared to the prior-year period, primarily driven by higher net sales of skin care products within the EMEA and Asia regions.
Digital Initiatives – Revlon is getting more aggressive in digital and e-commerce initiatives by setting up a new team of digital professionals realizing the importance of digital progress and social media in a brand’s reach and popularity among its clientele. Along with increasing ad investments, the company is also shifting most of its campaigns to the digital platform. Recently, Revlon collaborated with a leading digital consultancy, Sapient Razorfish, to create a stronger digital presence. These factors are positively working in its favor as an increasing number of customers are buying beauty products online.

Outlook for fiscal 2018 –Revlon is expected to reap stronger results in Q3 and beyond from the Elizabeth Arden integration and thus post healthier results in the coming quarters.
What’s behind Trefis? See How It’s Powering New Collaboration and What-Ifs
For CFOs and Finance Teams | Product, R&D, and Marketing Teams
Like our charts? Explore example interactive dashboards and create your own.
