How Will Qualcomm Stock React To Its Upcoming Earnings?

Qualcomm (NASDAQ:QCOM) is set to report its earnings on April 30, 2025. Revenues are estimated to grow by 13% year-over-year to $10.6 billion per consensus estimates, while earnings are expected to come in at $2.81 per share. Growth is likely to be driven by higher demand for the company’s chipsets, particularly from premium Android devices produced by Chinese vendors. While earnings are likely to be strong, investors will be closely watching Qualcomm’s guidance, especially given the recent trade war with China and other key trading partners. Qualcomm’s fabless business model, which depends on production in Asia, as well as its sizable exposure to China, which accounted for close to 46% of total revenue last fiscal year, put the company at risk.
Qualcomm has $156 billion in current market capitalization. Revenue over the last twelve months was $41 billion, and it was operationally profitable with roughly $11 billion in operating profits. That said, if you seek upside with lower volatility than individual stocks, the Trefis High-Quality portfolio presents an alternative, having outperformed the S&P 500 and generated returns exceeding 91% since its inception.
See earnings reaction history of all stocks
Qualcomm’s Historical Odds Of Positive Post-Earnings Return
- Qualcomm Stock Delivers Strong Cash Yield – Upside Ahead?
- Is Qualcomm Stock Built to Withstand More Downside?
- Is Qualcomm Stock’s 24% Drop A Bargain?
- A Money Making Strategy for Qualcomm’s Memory Crisis
- With Strong Cash Flow, Qualcomm Stock Poised to Rise?
- Strong Cash Yield: Is Qualcomm Stock A Buy?
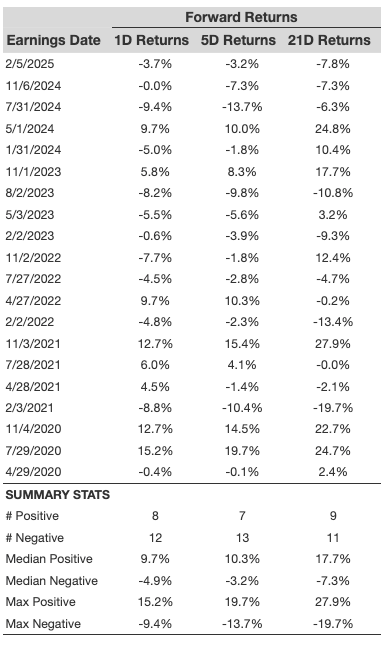
Some observations on one-day (1D) post-earnings returns:
- There are 20 earnings data points recorded over the last five years, with 8 positive and 12 negative one-day (1D) returns observed. In summary, positive 1D returns were seen about 40% of the time.
- However, this percentage decreases to 25% if we consider data for the last 3 years instead of 5.
- Median of the 8 positive returns = 9.7%, and median of the 12 negative returns = -4.9%
Additional data for observed 5-Day (5D), and 21-Day (21D) returns post earnings are summarized along with the statistics in the table below.
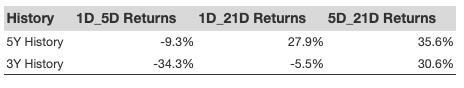
Correlation Between 1D, 5D, and 21D Historical Returns
A relatively less risky strategy (though not useful if the correlation is low) is to understand the correlation between short-term and medium-term returns post earnings, find a pair that has the highest correlation, and execute the appropriate trade. For example, if 1D and 5D show the highest correlation, a trader can position themselves “long” for the next 5 days if 1D post-earnings return is positive. Here is some correlation data based on 5-year and 3-year (more recent) history. Note that the correlation 1D_5D refers to the correlation between 1D post-earnings returns and subsequent 5D returns.
Learn more about Trefis RV strategy that has outperformed its all-cap stocks benchmark (combination of all 3, the S&P 500, S&P mid-cap, and Russell 2000), to produce strong returns for investors. Separately, if you want upside with a smoother ride than an individual stock like Qualcomm, consider the High Quality portfolio, which has outperformed the S&P, and clocked >91% returns since inception.
Invest with Trefis Market-Beating Portfolios
See all Trefis Price Estimates