How Will Prudential Financial Stock React To Its Upcoming Earnings?

Prudential Financial (NYSE:PRU) is set to report its earnings on April 30, 2025. Consensus points to earnings of about $3.18 per share for the quarter, up from $3.12 in the year-ago quarter. The company has been benefiting from relatively strong momentum in its global investment, insurance, and retirement businesses in recent quarters. The asset management business in particular has been faring well, led by higher assets under management and higher net inflows. Over Q4, assets under management stood at $1.512 billion, up about 4% year-over-year. However, there is a possibility that there could have been some headwinds over Q1 due to the stock market correction and uncertainty stemming from the trade war between the U.S. and key trading partners.
Prudential has $37 billion in current market capitalization. Revenue over the last twelve months was $71 billion and net income of $2.7 billion. That said, if you seek upside with lower volatility than individual stocks, the Trefis High-Quality portfolio presents an alternative, having outperformed the S&P 500 and generated returns exceeding 91% since its inception.
See earnings reaction history of all stocks
Prudential Financial’s Historical Odds Of Positive Post-Earnings Return
- Sell Prudential Financial Stock Ahead Of Upcoming Earnings?
- UP 19% Over The Last Year, What To Expect From Prudential Stock?
- Up 13% YTD, What To Expect From Prudential Financial Stock?
- Prudential Financial Stock To Post Mixed Results In Q4
- What To Expect From Prudential Financial Stock?
- Prudential Financial Stock To Edge Past The Consensus In Q2?
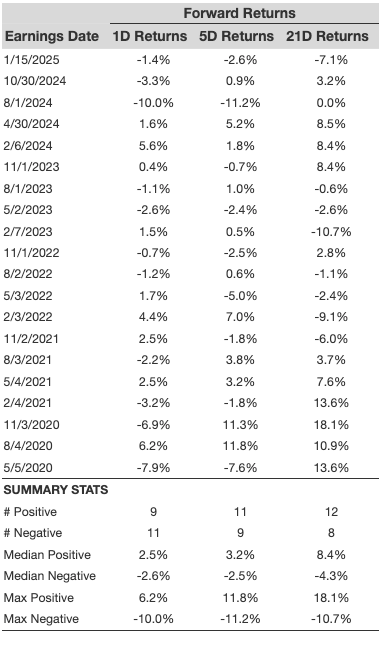
Some observations on one-day (1D) post-earnings returns:
- There are 20 earnings data points recorded over the last five years, with 9 positive and 11 negative one-day (1D) returns observed. In summary, positive 1D returns were seen about 45% of the time.
- However, this percentage decreases to 42% if we consider data for the last 3 years instead of 5.
- Median of the 9 positive returns = 2.5%, and median of the 11 negative returns = -2.6%
Additional data for observed 5-Day (5D), and 21-Day (21D) returns post earnings are summarized along with the statistics in the table below.
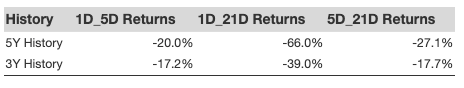
Correlation Between 1D, 5D, and 21D Historical Returns
A relatively less risky strategy (though not useful if the correlation is low) is to understand the correlation between short-term and medium-term returns post earnings, find a pair that has the highest correlation, and execute the appropriate trade. For example, if 1D and 5D show the highest correlation, a trader can position themselves “long” for the next 5 days if 1D post-earnings return is positive. Here is some correlation data based on 5-year and 3-year (more recent) history. Note that the correlation 1D_5D refers to the correlation between 1D post-earnings returns and subsequent 5D returns.
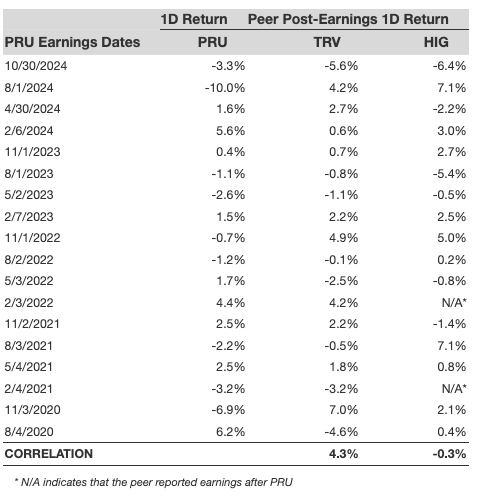
Is There Any Correlation With Peer Earnings?
Sometimes, peer performance can have influence on post-earnings stock reaction. In fact, the pricing-in might begin before the earnings are announced. Here is some historical data on the past post-earnings performance of Prudential Financial stock compared with the stock performance of peers that reported earnings just before Prudential Financial. For fair comparison, peer stock returns also represent post-earnings one-day (1D) returns. Learn more about Trefis RV strategy that has outperformed its all-cap stocks benchmark (combination of all 3, the S&P 500, S&P mid-cap, and Russell 2000), to produce strong returns for investors. Separately, if you want upside with a smoother ride than an individual stock like Prudential Financial, consider the High Quality portfolio, which has outperformed the S&P, and clocked >91% returns since inception.
Invest with Trefis Market-Beating Portfolios
See all Trefis Price Estimates