How NVIDIA Stock Might React To Upcoming Earnings?

NVIDIA (NASDAQ:NVDA) is set to report its earnings on Feb 26th, 2026 after market close. The semiconductor giant has $3.3 Tril in current market capitalization. Revenue over the last twelve months was $113 Bil, and the company was operationally profitable with $71 Bil in operating profits and net income of $63 Bil. While the post-earnings stock reaction will depend on how the results and outlook stack up against investor expectations, a detailed look at historical results can help if you are an event-driven trader. Here is how – either understand the historical odds and position yourself prior to the earnings announcement, or look at the correlation between immediate return and medium-term return post earnings and take a trade one-day after the announcement.
Image by Jacek Abramowicz from Pixabay
NVIDIA’s Historical Odds Of Positive Post-Earnings Return
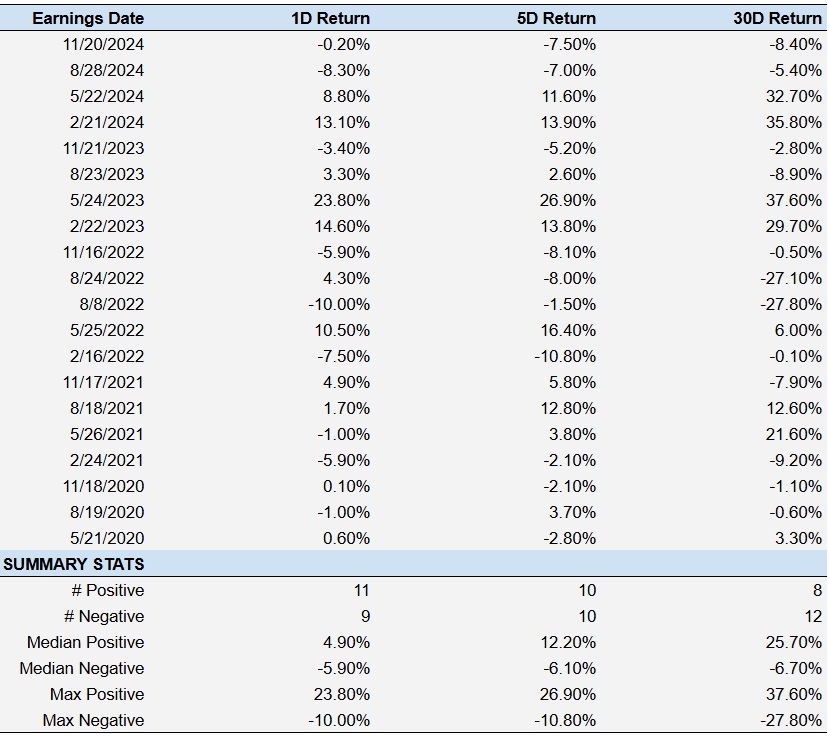
Some observations on one-day (1D) post earnings returns:
- In the past 5 years, 20 earnings data points recorded, with 11 positive and 9 negative one-day (1D) returns observed. In summary, positive 1D returns seen about 55% of the times
- In fact, this percentage has increased to 58% if we consider last 3 year data
- Median of the 11 positive returns = 4.9%, and median of the 9 negative returns = -5.9%
Additional data for observed returns 5-days (5D), and 30-days (30D) post earnings are summarized along with the statistics, in the table below.
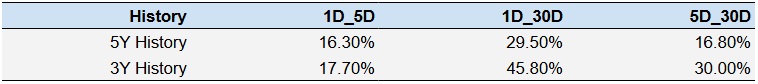
Correlation Between 1D, 5D, and 30D Historical Returns
A relatively less risky strategy (though not useful if correlation is low) is to understand the correlation between short-term and medium-term returns post earnings, find a pair that has highest correlation and execute the appropriate trade. For example, if 1D and 5D show the highest correlation, a trader can position themselves “long” for the next 5 days if 1D post-earnings return is positive. Here is some correlation data based on 5-year and 3-year (more recent) history. Note that the correlation 1D_5D refers to correlation between 1D post-earnings returns and subsequent 5D returns.
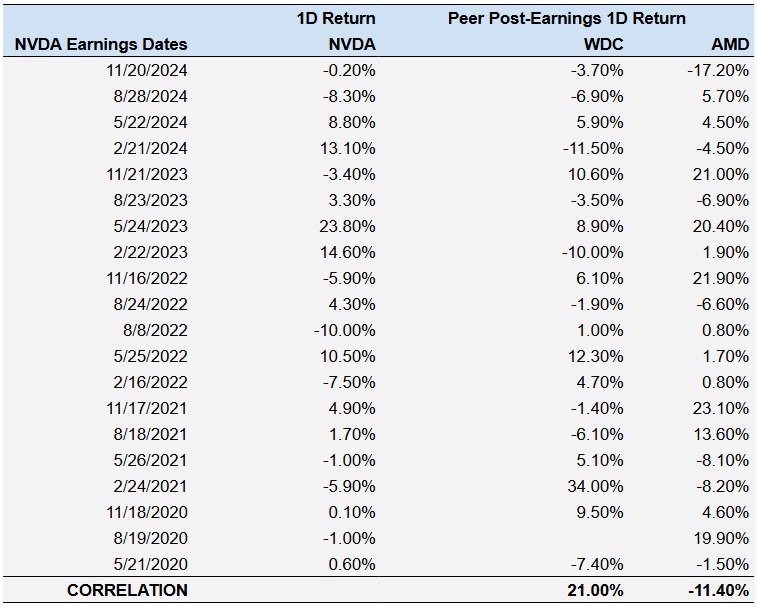
Is There Any Correlation With Peer Earnings?
Sometimes, peer performance can have influence on post-earnings stock-reaction. In fact, the pricing-in might begin before the earnings are announced. Here is some historical data on past post-earnings performance of NVIDIA stock compared with stock performance of peers that reported earnings just prior to NVIDIA. For fair comparison, peer stock returns also represent post-earnings one day (1D) return.
Learn more about Trefis RV strategy that has outperformed its all-cap stocks benchmark (combination of all 3, the S&P 500, S&P mid-cap, and Russell 2000), to produce strong returns for investors. Separately, if you want upside with a smoother ride than an individual stock like NVIDIA, consider the High Quality portfolio, which has outperformed the S&P, and clocked >91% returns since inception.