How Will Nike Stock React To Its Upcoming Q3 Earnings?

Nike (NYSE: NKE) is set to report its fiscal third-quarter earnings on Thursday, March 20, 2025. Analysts predict the company will report earnings of $0.28 per share on $11.02 billion in sales. This would represent a 64% decline in earnings and an 11% fall in sales compared to the previous year’s figures of $0.77 per share and $12.44 billion, respectively. Investors will closely watch the company’s performance amid ongoing challenges, including macro pressures, uneven consumer trends, and sluggish sales across various channels.
The company has $109 billion in current market capitalization. Revenue over the last twelve months was $49 billion, and it was operationally profitable with $5.5 billion in operating profits and a net income of $4.9 billion. While a lot will depend on how results stack up against consensus and expectations, understanding historical patterns might just turn the odds in your favor if you are an event-driven trader.
There are two ways to do that: understand the historical odds and position yourself before the earnings release, or look at the correlation between immediate and medium-term returns post-earnings and position yourself accordingly after the earnings are released. That said, if you seek upside with lower volatility than individual stocks, the Trefis High-Quality portfolio presents an alternative – having outperformed the S&P 500 and generated returns exceeding 91% since its inception. See earnings reaction history of all stocks.

Nike’s Historical Odds Of Positive Post-Earnings Return
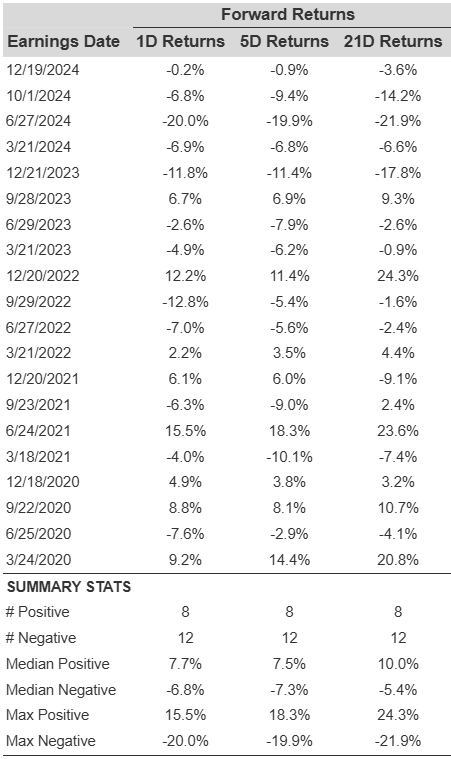
Some observations on one-day (1D) post-earnings returns:
- There are 20 earnings data points recorded over the last five years, with 8 positive and 12 negative one-day (1D) returns observed. In summary, positive 1D returns were seen about 40% of the time.
- However, this percentage decreases to 25% if we consider data for the last 3 years instead of 5.
- Median of the 8 positive returns = 7.7%, and median of the 12 negative returns =-6.8%
Additional data for observed 5-Day (5D), and 21-Day (21D) returns post earnings are summarized along with the statistics in the table below.
Correlation Between 1D, 5D, and 21D Historical Returns
A relatively less risky strategy (though not useful if the correlation is low) is to understand the correlation between short-term and medium-term returns post earnings, find a pair that has the highest correlation, and execute the appropriate trade. For example, if 1D and 5D show the highest correlation, a trader can position themselves “long” for the next 5 days if 1D post-earnings return is positive. Here is some correlation data based on 5-year and 3-year (more recent) history. Note that the correlation 1D_5D refers to the correlation between 1D post-earnings returns and subsequent 5D returns.
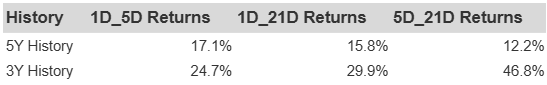
NKE Correlation Between 1D, 5D and 21D Historical Returns
Learn more about Trefis RV strategy that has outperformed its all-cap stocks benchmark (combination of all 3, the S&P 500, S&P mid-cap, and Russell 2000), to produce strong returns for investors.
| Returns | Mar 2025 MTD [1] |
2025 YTD [1] |
2017-25 Total [2] |
| NKE Return | -7% | -2% | 60% |
| S&P 500 Return | -5% | -4% | 153% |
| Trefis Reinforced Value Portfolio | -6% | -8% | 552% |
[1] Returns as of 3/18/2025
[2] Cumulative total returns since the end of 2016
Invest with Trefis Market-Beating Portfolios