How Will Nasdaq Stock React To Its Upcoming Earnings?

Nasdaq (NASDAQ:NDAQ) is set to report its Q1 2025 earnings on Thursday, April 24, 2025. Revenues are projected to grow by about 10% year-over-year to $1.23 billion, while earnings are projected to come in at about $0.77 per share, up about $0.14 versus a year ago. Several trends have been driving the company’s performance in recent quarters, including stronger demand for Nasdaq’s tech and data solutions, a higher mix of recurring and software-based income, driven by a shift to subscription models. Moreover, the exchange has also been witnessing strong interest in Nasdaq-linked index products.
The company has $42 billion in current market capitalization. Revenue over the last twelve months stood at $7.4 billion, and it was operationally profitable with $1.9 Bil in operating profits and a net income of $1.1 billion. That said, if you seek upside with lower volatility than individual stocks, the Trefis High-Quality portfolio presents an alternative – having outperformed the S&P 500 and generated returns exceeding 91% since its inception.
See earnings reaction history of all stocks
Nasdaq’s Historical Odds Of Positive Post-Earnings Return
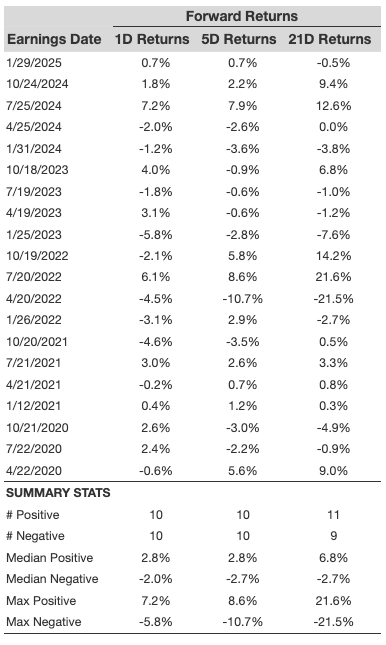
Some observations on one-day (1D) post-earnings returns:
- There are 20 earnings data points recorded over the last five years, with 10 positive and 10 negative one-day (1D) returns observed. In summary, positive 1D returns were seen about 50% of the time.
- The percentage remains the same at 50% if we consider data for the last 3 years instead of 5.
- Median of the 10 positive returns = 2.8%, and median of the 10 negative returns = -2.0%
Additional data for observed 5-Day (5D) and 21-Day (21D) returns post earnings are summarized along with the statistics in the table below.
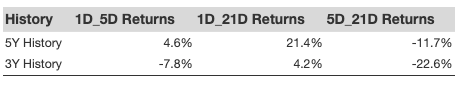
Correlation Between 1D, 5D, and 21D Historical Returns
A relatively less risky strategy (though not useful if the correlation is low) is to understand the correlation between short-term and medium-term returns post-earnings, find a pair that has the highest correlation, and execute the appropriate trade. For example, if 1D and 5D show the highest correlation, a trader can position themselves “long” for the next 5 days if 1D post-earnings return is positive. Here is some correlation data based on a 5-year and 3-year (more recent) history. Note that the correlation 1D_5D refers to the correlation between 1D post-earnings returns and subsequent 5D returns.
Learn more about Trefis RV strategy that has outperformed its all-cap stocks benchmark (combination of all 3, the S&P 500, S&P mid-cap, and Russell 2000), to produce strong returns for investors. Separately, if you want upside with a smoother ride than an individual stock like Nasdaq, consider the High Quality portfolio, which has outperformed the S&P, and clocked >91% returns since inception.
Invest with Trefis Market-Beating Portfolios
See all Trefis Price Estimates