Meta Platforms Stock Is Up Twice As Much As S&P500, What To Expect From Q2 Results?

Meta Platforms (NASDAQ: META) stock gained 28% YTD, as compared to a 14% rise in the S&P500 index. Notably, Meta Platforms’ peer Alphabet (Google) (NASDAQ: GOOG) is up 20% YTD. Overall, META is scheduled to report its fiscal Q2 2024 results on Wednesday, July 31, 2024. We expect the stock to edge past the consensus estimates of revenues and earnings (match). The company outperformed the expectations in the last quarter, with revenues increasing 27% y-o-y to $36.5 billion. Further, the key metrics – family daily active people (DAP), ad impressions, and average price per ad, also improved in the quarter. We expect the same trend to continue in the second quarter. Our interactive dashboard analysis on Meta Platforms’ Earnings Preview has more details.
Amid the current financial backdrop, META stock has seen extremely strong gains of 65% from levels of $275 in early January 2021 to around $455 now, vs. an increase of about 45% for the S&P 500 over this roughly 3-year period. However, the increase in META stock has been far from consistent. Returns for the stock were 23% in 2021, -64% in 2022, and 194% in 2023. In comparison, returns for the S&P 500 have been 27% in 2021, -19% in 2022, and 24% in 2023 – indicating that META underperformed the S&P in 2021 and 2022. In fact, consistently beating the S&P 500 – in good times and bad – has been difficult over recent years for individual stocks; for other heavyweights in the Communication Services sector including GOOG, NFLX, and TMUS, and even for the megacap stars TSLA, MSFT, and AMZN. In contrast, the Trefis High Quality (HQ) Portfolio, with a collection of 30 stocks, has outperformed the S&P 500 each year over the same period. Why is that? As a group, HQ Portfolio stocks provided better returns with less risk versus the benchmark index; less of a roller-coaster ride as evident in HQ Portfolio performance metrics. Given the current uncertain macroeconomic environment with high oil prices and elevated interest rates, could META face a similar situation as it did in 2021 and 2022 and underperform the S&P over the next 12 months – or will it see a strong jump?
Our forecast indicates that Meta Platforms’ valuation is $509 per share, which is 12% above the current market price of around $453.
(1) Revenues expected to top the expectations
Meta Platforms’ revenues grew 16% y-o-y to $134.9 billion in FY 2023. The increase was mainly due to higher family daily active people (DAP) and ad impressions, partially offset by a drop in average price per ad. That said, all three metrics improved in Q1 and we expect the second quarter results to be on similar lines. Overall, Meta Platforms’ revenues are estimated to touch $159.6 billion in FY2024.
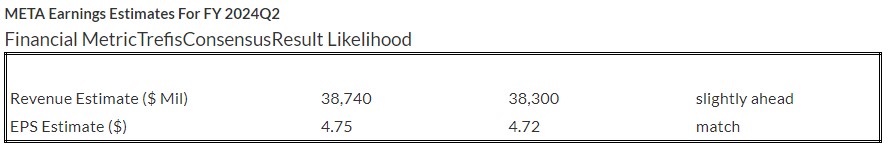
Trefis estimates Meta Platforms’ fiscal Q2 2024 net revenues to be around $38.74 billion, 1% above the $38.30 billion consensus estimate.
(2) EPS to edge past (match) the consensus
Meta Platforms Q2 2024 adjusted earnings per share (EPS) is expected to be $4.75 per Trefis analysis, just above the consensus estimate of $4.72. The company’s net income grew 69% y-o-y to $39.1 billion in FY 2023 driven by revenue growth and lower total expenses as a % of revenues. Further, the same momentum continued in Q1 2024, leading to an operating margin of 38% vs 25%. We expect the same trend to drive the second quarter results. Overall, we estimate an annual GAAP EPS of around $20.05 in FY2024.
(3) Stock price estimate is 12% above the current market price
We arrive at Meta Platforms’ valuation, using a GAAP EPS estimate of around $20.05 and a P/E multiple of just above 25x in fiscal 2024. This translates into a price of $509, which is 12% above the current market price.
Note: P/E Multiples are based on Share Price at the end of the year and reported (or expected) Adjusted Earnings for the full year
| Returns | Jul 2024 MTD [1] |
2024 YTD [1] |
2017-24 Total [2] |
| META Return | -10% | 28% | 295% |
| S&P 500 Return | -1% | 14% | 142% |
| Trefis Reinforced Value Portfolio | -1% | 6% | 684% |
[1] Returns as of 7/26/2024
[2] Cumulative total returns since the end of 2016
Invest with Trefis Market-Beating Portfolios
See all Trefis Price Estimates