How Will Mastercard Stock React To Its Upcoming Earnings?

Mastercard (NYSE:MA) is set to report its earnings on Monday, May 5, 2025. Revenues are projected to grow by about 12% year-over-year to $7.13 billion, per consensus estimates, while adjusted earnings are expected to come in at about $3.57 per share, a bit higher than last year. Growth is likely to be driven by rising payment volumes as well as higher cross-border volumes, which are typically more lucrative. That said, investors will focus more on Mastercard’s outlook. The U.S. economy could face multiple headwinds in the near term following tariffs imposed by President Donald Trump on major trading partners. While Mastercard has a more balanced geographic exposure in comparison with its rivals, its business could still see headwinds given that it is largely tied to consumer spending and international travel volumes.
The company has $489 billion in current market capitalization. Revenue over the last twelve months was $28 billion, and it was operationally profitable with $16 billion in operating profits and net income of $13 billion. That said, if you seek upside with lower volatility than individual stocks, the Trefis High Quality portfolio presents an alternative, having outperformed the S&P 500 and generated returns exceeding 91% since its inception.
See earnings reaction history of all stocks
Mastercard’s Historical Odds Of Positive Post-Earnings Return
- Mastercard Stock Pays Out $64 Bil – Investors Take Note
- Mastercard Stock Pays Out $64 Bil – Investors Take Note
- Why Does Mastercard Want To Buy ZeroHash?
- How Will Mastercard Stock React To Its Upcoming Earnings?
- Mastercard Stock Delivers $63 Bil to Shareholders Over the Last 10 Years
- MA Has Paid Out $63 Bil to Investors in the Past Decade
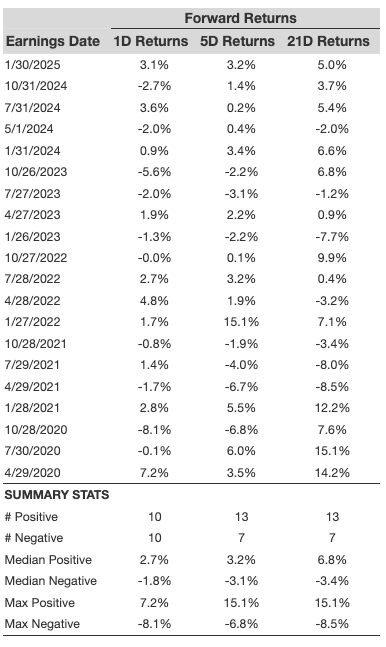
Some observations on one-day (1D) post-earnings returns:
- There are 20 earnings data points recorded over the last five years, with 10 positive and 10 negative one-day (1D) returns observed. In summary, positive 1D returns were seen about 50% of the time.
- The percentage remains the same at 50% if we consider data for the last 3 years instead of 5.
- Median of the 10 positive returns = 2.7%, and median of the 10 negative returns = -1.8%
Additional data for observed 5-Day (5D), and 21-Day (21D) returns post earnings are summarized along with the statistics in the table below.
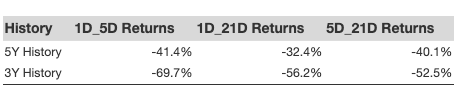
Correlation Between 1D, 5D, and 21D Historical Returns
A relatively less risky strategy (though not useful if the correlation is low) is to understand the correlation between short-term and medium-term returns post earnings, find a pair that has the highest correlation, and execute the appropriate trade. For example, if 1D and 5D show the highest correlation, a trader can position themselves “long” for the next 5 days if 1D post-earnings return is positive. Here is some correlation data based on a 5-year and a 3-year (more recent) history. Note that the correlation 1D_5D refers to the correlation between 1D post-earnings returns and subsequent 5D returns.
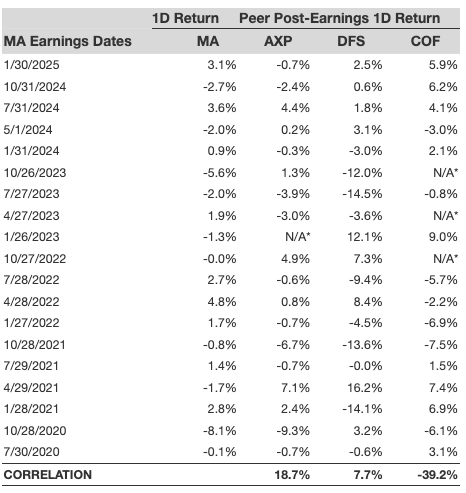
Is There Any Correlation With Peer Earnings?
Sometimes, peer performance can have influence on post-earnings stock reaction. In fact, the pricing-in might begin before the earnings are announced. Here is some historical data on the past post-earnings performance of Mastercard stock compared with the stock performance of peers that reported earnings just before Mastercard. For fair comparison, peer stock returns also represent post-earnings one-day (1D) returns.
Learn more about Trefis RV strategy that has outperformed its all-cap stocks benchmark (combination of all 3, the S&P 500, S&P mid-cap, and Russell 2000), to produce strong returns for investors. Separately, if you want upside with a smoother ride than an individual stock like Mastercard, consider the High Quality portfolio, which has outperformed the S&P, and clocked >91% returns since inception.
Invest with Trefis Market-Beating Portfolios
See all Trefis Price Estimates