How Will Eli Lilly Stock React To Its Upcoming Earnings?

Eli Lilly (NYSE:LLY) is scheduled to release its earnings report on Thursday, May 1, 2025. For event-driven traders, historical stock performance following earnings announcements may offer valuable insights. Over the past five years, LLY stock has shown a tendency to move upward after earnings releases. Specifically, the stock has experienced a positive one-day return in 55% of these instances. When positive, the median return has been 4.5%, with a maximum single-day positive surge of 14.9%.
While the actual stock movement will ultimately depend on how the reported results compare to market consensus and expectations, understanding these historical patterns could potentially improve trading odds. Traders might consider two main approaches based on this historical data: either establish a position before the earnings announcement to capitalize on the historical probability of a positive reaction, or analyze the correlation between immediate and medium-term returns after the earnings are released to inform subsequent positioning.
Current consensus estimates project LLY’s earnings per share to be $3.46 on revenues of $12.72 billion. This represents a significant year-over-year increase compared to the previous period’s earnings of $2.58 per share on sales of $8.77 billion, indicating an anticipated 34% jump in earnings and a 45% surge in sales. A key driver for this growth is the strong demand for LLY’s obesity drug, Zepbound, which is projected to contribute $2.2 billion in sales. Additionally, sales of Mounjaro are expected to reach approximately $3.75 billion.
From a fundamental perspective, Eli Lilly currently holds a market capitalization of $789 billion. Over the trailing twelve months, the company generated $45 billion in revenue, achieving an operating profit of $18 billion and a net income of $11 billion.
If you seek upside with lower volatility than individual stocks, the Trefis High Quality portfolio presents an alternative — having outperformed the S&P 500 and generated returns exceeding 91% since its inception.
See earnings reaction history of all stocks

Image by HeungSoon from Pixabay
Eli Lilly’s Historical Odds Of Positive Post-Earnings Return
Some observations on one-day (1D) post-earnings returns:
- There are 18 earnings data points recorded over the last five years, with 8 positive and 10 negative one-day (1D) returns observed. In summary, positive 1D returns were seen about 44% of the time.
- Notably, this percentage increases to 45% if we consider data for the last 3 years instead of 5.
- Median of the 8 positive returns = 4.5%, and median of the 10 negative returns = -3.1%
Additional data for observed 5-Day (5D), and 21-Day (21D) returns post earnings are summarized along with the statistics in the table below.

LLY 1D, 5D, and 21D Post Earnings Return
Correlation Between 1D, 5D, and 21D Historical Returns
A relatively less risky strategy (though not useful if the correlation is low) is to understand the correlation between short-term and medium-term returns post earnings, find a pair that has the highest correlation, and execute the appropriate trade. For example, if 1D and 5D show the highest correlation, a trader can position themselves “long” for the next 5 days if 1D post-earnings return is positive. Here is some correlation data based on 5-year and 3-year (more recent) history. Note that the correlation 1D_5D refers to the correlation between 1D post-earnings returns and subsequent 5D returns.
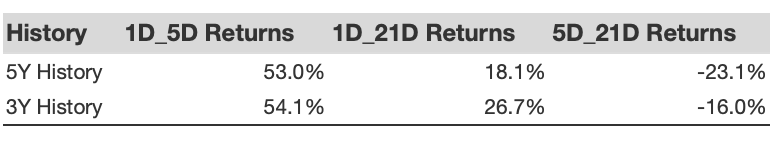
LLY Correlation Between 1D, 5D and 21D Historical Returns
Is There Any Correlation With Peer Earnings?
Sometimes, peer performance can have influence on post-earnings stock reaction. In fact, the pricing-in might begin before the earnings are announced. Here is some historical data on the past post-earnings performance of Eli Lilly and stock compared with the stock performance of peers that reported earnings just before Eli Lilly and. For fair comparison, peer stock returns also represent post-earnings one-day (1D) returns.
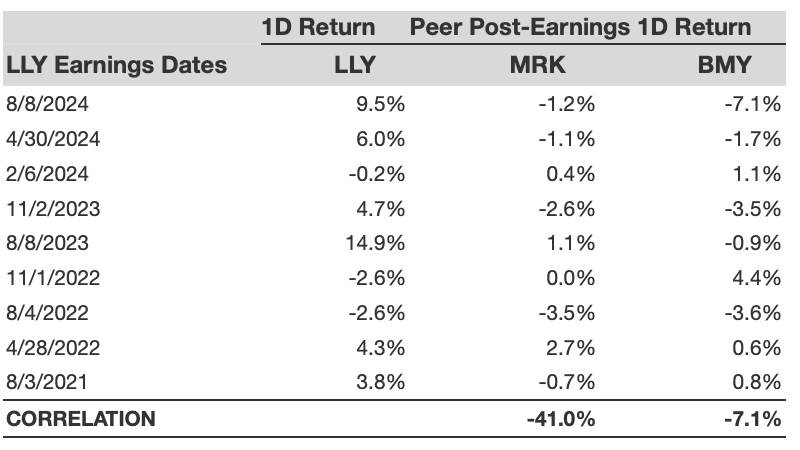
LLY Correlation With Peer Earnings
Learn more about Trefis RV strategy that has outperformed its all-cap stocks benchmark (combination of all 3, the S&P 500, S&P mid-cap, and Russell 2000), to produce strong returns for investors. Separately, if you want upside with a smoother ride than an individual stock like Eli Lilly, consider the High Quality portfolio, which has outperformed the S&P, and clocked >91% returns since inception.
Invest with Trefis Market-Beating Portfolios
See all Trefis Price Estimates