How Will Kinder Morgan Stock React To Its Upcoming Q1 Earnings?

Kinder Morgan (NYSE: KMI) is a major energy infrastructure company focused on transporting and storing natural gas, oil, CO₂, and bulk materials. The company is set to report its fiscal first-quarter earnings on Wednesday, April 16, 2025. Analysts predict the company will report earnings of $0.36 per share on $4.02 billion in sales. This would represent a 9% increase in earnings and a 5% growth in sales compared to the previous year’s figures of $0.33 per share and $3.83 billion, respectively. Historically, the stock has declined following earnings 60% of the time, with a median one-day drop of 2.0% and a maximum decline of 6%.
With rising demand for natural gas driven by LNG exports, power generation, and AI, investors will closely watch the results. The company has $59 billion in current market capitalization. Revenue over the last twelve months was $15 billion, and it was operationally profitable with $4.2 billion in operating profits and net income of $2.5 billion. While a lot will depend on how results stack up against consensus and expectations, understanding historical patterns might turn the odds in your favor if you are an event-driven trader.
For event-driven traders, historical patterns may offer an edge, whether by positioning ahead of earnings or reacting to post-release moves. That said, if you seek upside with lower volatility than individual stocks, the Trefis High-Quality portfolio presents an alternative, having outperformed the S&P 500 and generated returns exceeding 91% since its inception. See earnings reaction history of all stocks.

Image by Jim Black from Pixabay
- With Strong Cash Flow, Qualcomm Stock Poised to Rise?
- Why RMD Could Outperform Abbott Laboratories Stock
- Stronger Bet Than McDonald’s Stock: DRI, QSR Deliver More
- Better Value & Growth: PTC Leads Oracle Stock
- META Tops Alphabet Stock on Price & Potential
- Better Value & Growth: WAB Leads Caterpillar Stock
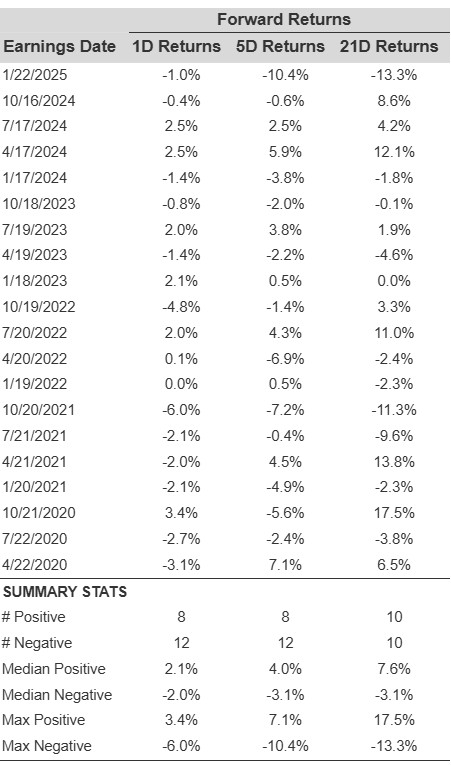
KMI’s Historical Odds Of Positive Post-Earnings Return
Some observations on one-day (1D) post-earnings returns:
- There are 20 earnings data points recorded over the last five years, with 8 positive and 12 negative one-day (1D) returns observed. In summary, positive 1D returns were seen about 40% of the time.
- Notably, this percentage increases to 50% if we consider data for the last 3 years instead of 5.
- Median of the 8 positive returns = 2.1%, and median of the 12 negative returns = -2.0%
Additional data for observed 5-Day (5D), and 21-Day (21D) returns post earnings are summarized along with the statistics in the table below.
Correlation Between 1D, 5D, and 21D Historical Returns
A relatively less risky strategy (though not useful if the correlation is low) is to understand the correlation between short-term and medium-term returns post earnings, find a pair that has the highest correlation, and execute the appropriate trade. For example, if 1D and 5D show the highest correlation, a trader can position themselves “long” for the next 5 days if 1D post-earnings return is positive. Here is some correlation data based on 5-year and 3-year (more recent) history. Note that the correlation 1D_5D refers to the correlation between 1D post-earnings returns and subsequent 5D returns.

KMI Correlation Between 1D, 5D and 21D Historical Returns
Learn more about Trefis RV strategy that has outperformed its all-cap stocks benchmark (combination of all 3, the S&P 500, S&P mid-cap, and Russell 2000), to produce strong returns for investors.
Invest with Trefis Market-Beating Portfolios