How Will Intel Stock React To Its Upcoming Earnings?

Intel (NASDAQ:INTC) is set to report its earnings on Thursday, April 24, 2025. The company is expected to roughly break even this quarter, with an EPS of $0, per consensus estimates, compared to adjusted earnings of about $0.18 per share in the year-ago quarter. Revenues are expected to decline by about 3% to $12.31 billion. Intel has been witnessing considerable headwinds in its CPU business amid continued market share losses in the server and client computing space and relatively lackluster growth in the broader market. The broader market pivot from CPUs to GPUs in the AI age has also been impacting the company’s performance. Intel stock has typically fared poorly post its earnings releases. Based on data from the last 5 years, the stock has seen positive returns a mere 30% of the time, one day post-earnings.
Intel has $82 Bil in current market capitalization. Revenue over the last twelve months was $53 billion, and it was operationally loss-making with $-4.7 billion in operating losses and net loss of $-19 billion. That said, if you seek upside with lower volatility than individual stocks, the Trefis High-Quality portfolio presents an alternative, having outperformed the S&P 500 and generated returns exceeding 91% since its inception.
See earnings reaction history of all stocks
Intel’s Historical Odds Of Positive Post-Earnings Return
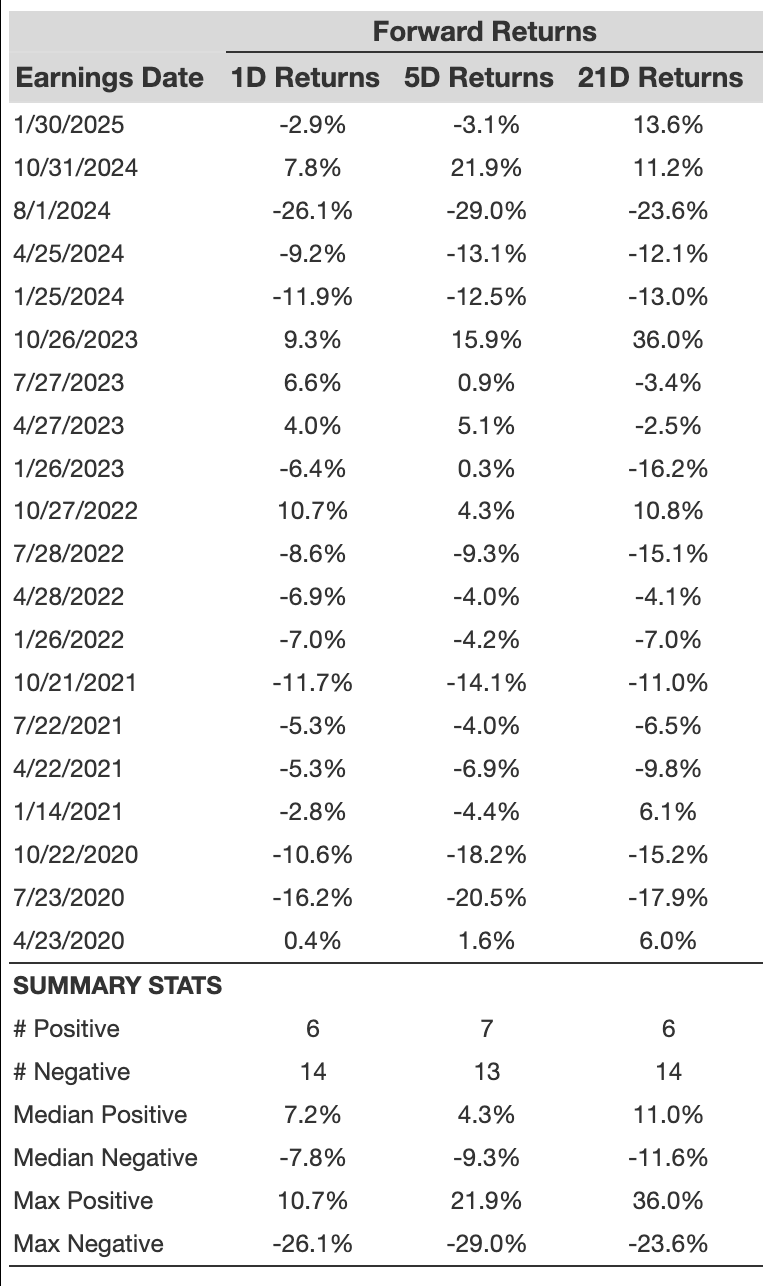
Some observations on one-day (1D) post-earnings returns:
- There are 20 earnings data points recorded over the last five years, with 6 positive and 14 negative one-day (1D) returns observed. In summary, positive 1D returns were seen about 30% of the time.
- Notably, this percentage increases to 42% if we consider data for the last 3 years instead of 5.
- Median of the 6 positive returns = 7.2%, and median of the 14 negative returns = -7.8%
Additional data for observed 5-Day (5D), and 21-Day (21D) returns post earnings are summarized along with the statistics in the table below.
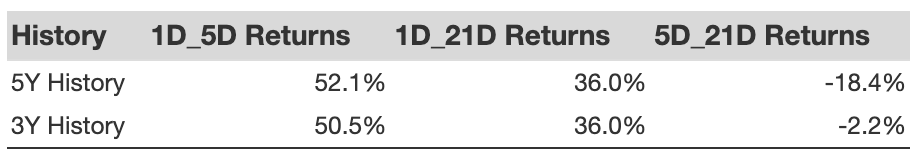
Correlation Between 1D, 5D, and 21D Historical Returns
A relatively less risky strategy (though not useful if the correlation is low) is to understand the correlation between short-term and medium-term returns post earnings, find a pair that has the highest correlation, and execute the appropriate trade. For example, if 1D and 5D show the highest correlation, a trader can position themselves “long” for the next 5 days if the 1D post-earnings return is positive. Here is some correlation data based on a 5-year and a 3-year (more recent) history. Note that the correlation 1D to 5D refers to the correlation between 1D post-earnings returns and subsequent 5D returns.
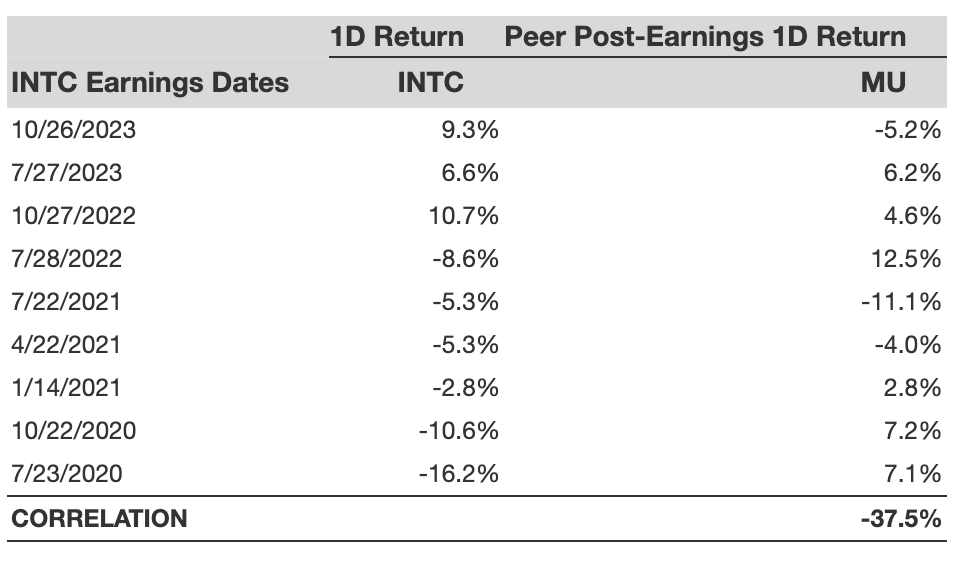
Is There Any Correlation With Peer Earnings?
Sometimes, peer performance can have influence on post-earnings stock reaction. In fact, the pricing-in might begin before the earnings are announced. Here is some historical data on the past post-earnings performance of Intel stock compared with the stock performance of peers that reported earnings just before Intel. For fair comparison, peer stock returns also represent post-earnings one-day (1D) returns.
Learn more about Trefis RV strategy that has outperformed its all-cap stocks benchmark (combination of all 3, the S&P 500, S&P mid-cap, and Russell 2000), to produce strong returns for investors. Separately, if you want upside with a smoother ride than an individual stock like Intel, consider the High Quality portfolio, which has outperformed the S&P, and clocked >91% returns since inception.
Invest with Trefis Market Beating Portfolios
See all Trefis Price Estimates