How Will Honeywell International Stock React To Its Upcoming Earnings?

Honeywell International (NASDAQ:HON) is scheduled to release its earnings report on Tuesday, April 29, 2025. An analysis of its earnings performance over the past five years reveals a historical tendency for negative one-day returns following the announcement, occurring in 60% of the observed instances. These negative returns have had a median of -3.2% and a maximum of -7.6%.
Current consensus estimates anticipate earnings per share (EPS) of $2.21 on revenues of $9.6 billion for this period. This compares to the prior year’s earnings of $2.25 per share on revenues of $9.1 billion, suggesting analyst expectations of margin compression despite projected mid-single-digit revenue growth. In the preceding quarter, Honeywell’s building automation business demonstrated strong growth of 20%, a trend that is anticipated to persist, while the safety and sensing technologies segment is expected to experience weaker demand.
For event-driven traders, understanding these historical patterns could offer a potential edge, although the actual market reaction will depend on how the reported results compare to consensus estimates and broader market expectations. There are generally two approaches to consider: either anticipate the immediate post-earnings move by understanding historical probabilities and positioning accordingly before the release, or analyze the correlation between short-term and medium-term returns after the announcement to inform subsequent trading strategies.
That said, if you seek upside with lower volatility than individual stocks, the Trefis High Quality portfolio presents an alternative – having outperformed the S&P 500 and generated returns exceeding 91% since its inception.
- Honeywell’s Margin Expansion Play: What the Bears Are Missing
- Honeywell International Stock Shares $43 Bil Success With Investors
- 3M Stock vs. Honeywell Stock: Which Is A Better Investment?
- Honeywell International Stock at Support Zone – Bargain or Trap?
- Buy or Sell Honeywell International Stock?
- HON Capital Return Hits $44 Bil in 10 Years
See earnings reaction history of all stocks

Image by wiredsmart from Pixabay
Honeywell International’s Historical Odds Of Positive Post-Earnings Return
Some observations on one-day (1D) post-earnings returns:
- There are 20 earnings data points recorded over the last five years, with 8 positive and 12 negative one-day (1D) returns observed. In summary, positive 1D returns were seen about 40% of the time.
- Notably, this percentage increases to 58% if we consider data for the last 3 years instead of 5.
- Median of the 8 positive returns = 2.4%, and median of the 12 negative returns = -3.2%
Additional data for observed 5-Day (5D), and 21-Day (21D) returns post earnings are summarized along with the statistics in the table below.
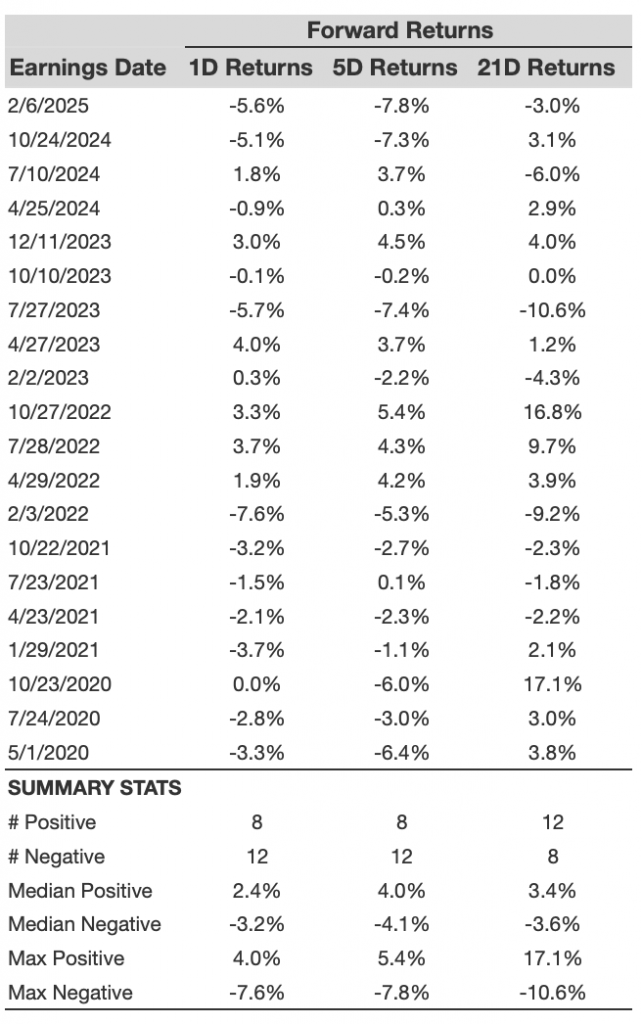
HON 1D, 5D, and 21D post earnings return
Correlation Between 1D, 5D, and 21D Historical Returns
A relatively less risky strategy (though not useful if the correlation is low) is to understand the correlation between short-term and medium-term returns post earnings, find a pair that has the highest correlation, and execute the appropriate trade. For example, if 1D and 5D show the highest correlation, a trader can position themselves “long” for the next 5 days if 1D post-earnings return is positive. Here is some correlation data based on 5-year and 3-year (more recent) history. Note that the correlation 1D_5D refers to the correlation between 1D post-earnings returns and subsequent 5D returns.

HON Correlation Between 1D, 5D and 21D Historical Returns
Is There Any Correlation With Peer Earnings?
Sometimes, peer performance can have influence on post-earnings stock reaction. In fact, the pricing-in might begin before the earnings are announced. Here is some historical data on the past post-earnings performance of Honeywell International stock compared with the stock performance of peers that reported earnings just before Honeywell International. For fair comparison, peer stock returns also represent post-earnings one-day (1D) returns.
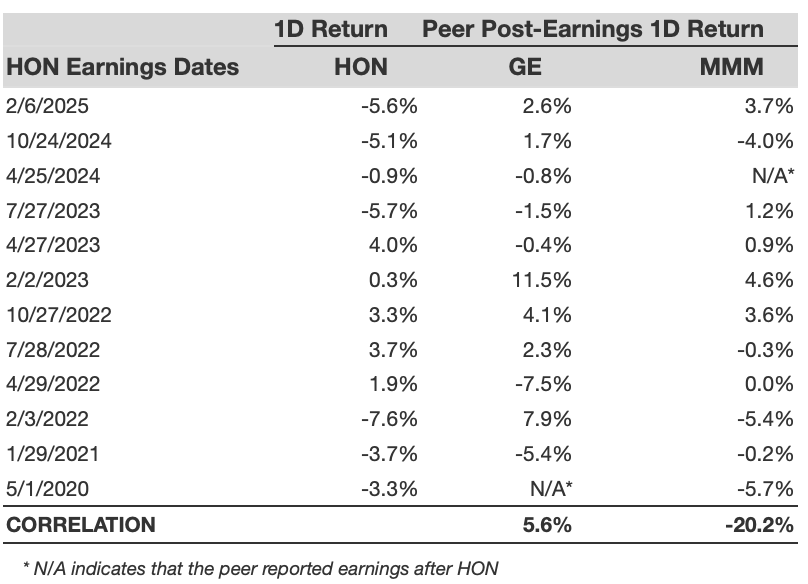
HON Correlation With Peer Earnings
Learn more about Trefis RV strategy that has outperformed its all-cap stocks benchmark (combination of all 3, the S&P 500, S&P mid-cap, and Russell 2000), to produce strong returns for investors. Separately, if you want upside with a smoother ride than an individual stock like Honeywell International, consider the High Quality portfolio, which has outperformed the S&P, and clocked >91% returns since inception.
Invest with Trefis Market-Beating Portfolios
See all Trefis Price Estimates