How Will Harley-Davidson Stock React To Its Upcoming Earnings?

Harley-Davidson (NYSE:HOG) is set to report its earnings in the next few weeks. The iconic motorcycling giant has been facing headwinds in recent quarters due to a higher interest rate environment, which has impacted consumer confidence. Things could remain tough over Q1 as well, with motorcycle sales remaining sluggish in the U.S. Per MotorCycles Data, overall motorbike sales in the U.S. during February fell by 20.7% compared to the previous year. The weak consumer environment has been further compounded by the uncertainty from President Donald Trump’s imposition of a slew of tariffs on over 100 countries. Consensus estimates peg revenues at about $1.11 billion, while earnings are estimated to come in at $0.78 per share, down from $1.72 in the year-ago quarter.
Harley stock has declined by over 25% year-to-date. The company has $2.7 billion in current market capitalization, and revenue over the last twelve months stood at $5.2 Bil, and it was operationally profitable with $417 million in operating profits and a net income of $455 million. That said, if you seek upside with lower volatility than individual stocks, the Trefis High-Quality portfolio presents an alternative – having outperformed the S&P 500 and generated returns exceeding 91% since its inception.
See earnings reaction history of all stocks
Harley-Davidson’s Historical Odds Of Positive Post-Earnings Return
- How Will Harley-Davidson Stock React To Its Upcoming Earnings?
- Can Harley Stock Bounce Back Despite Tough Earnings?
- Can Harley Stock Bounce Back To $50 Following Rate Cuts
- Can Harley Stock Recover To $50 On Strong Touring Motorcycle Sales?
- Can Harley-Davidson Stock Rally 50% To Its Pre-Inflation Shock Highs?
- With Rate Cuts Around The Corner, Can Harley-Davidson Stock Recover To Over $50?
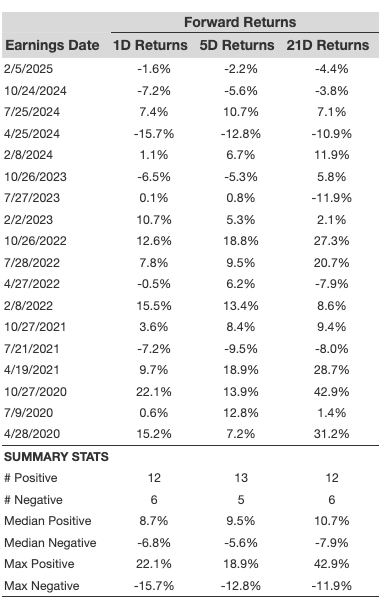
Some observations on one-day (1D) post-earnings returns:
- There are 18 earnings data points recorded over the last five years, with 12 positive and 6 negative one-day (1D) returns observed. In summary, positive 1D returns were seen about 67% of the time.
- However, this percentage decreases to 55% if we consider data for the last 3 years instead of 5.
- Median of the 12 positive returns = 8.7%, and median of the 6 negative returns = -6.8%
Additional data for observed 5-Day (5D), and 21-Day (21D) returns post earnings are summarized along with the statistics in the table below.
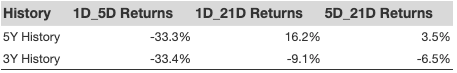
Correlation Between 1D, 5D, and 21D Historical Returns
A relatively less risky strategy (though not useful if the correlation is low) is to understand the correlation between short-term and medium-term returns post-earnings, find a pair that has the highest correlation, and execute the appropriate trade. For example, if 1D and 5D show the highest correlation, a trader can position themselves “long” for the next 5 days if 1D post-earnings return is positive. Here is some correlation data based on a 5-year and 3-year (more recent) history. Note that the correlation 1D_5D refers to the correlation between 1D post-earnings returns and subsequent 5D returns.
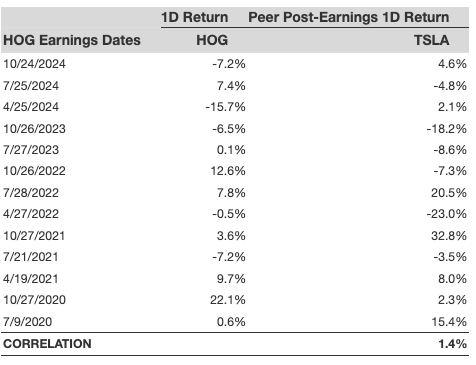
 Is There Any Correlation With Peer Earnings?
Sometimes, peer performance can have influence on post-earnings stock reaction. In fact, the pricing-in might begin before the earnings are announced. Here is some historical data on the past post-earnings performance of Harley-Davidson stock compared with the stock performance of peers that reported earnings just before Harley-Davidson. For fair comparison, peer stock returns also represent post-earnings one-day (1D) returns.
Learn more about Trefis RV strategy that has outperformed its all-cap stocks benchmark (combination of all 3, the S&P 500, S&P mid-cap, and Russell 2000), to produce strong returns for investors. Separately, if you want upside with a smoother ride than an individual stock like Harley-Davidson, consider the High Quality portfolio, which has outperformed the S&P, and clocked >91% returns since inception.
Invest with Trefis Market-Beating Portfolios
See all Trefis Price Estimates