How Will General Motors Stock React To Its Upcoming Earnings?

General Motors (NYSE:GM) is set to report earnings on Tuesday, April 29, 2025. Consensus estimates project earnings of $2.65 per share on revenue of $43 billion, roughly flat year-over-year, but there’s a possibility that results could surprise on the upside. Customers likely doubled down on vehicle purchases in March, anticipating fallout from President Trump’s proposed automotive import tariffs. GM reported 17% year-over-year growth in U.S. sales for Q1 2025, outperforming other major automakers. The company saw strong gains in full-size SUV sales, while EV sales picked up, taking share from rivals such as Tesla.
Overall, we will be closely watching GM’s outlook, given the potential impact of tariffs. Just over 50% of GM vehicles sold in the U.S. are built domestically, leaving the company exposed to higher costs on imports as well as foreign-made components used in U.S. assembly.
GM has $47 billion in current market capitalization. Revenue over the last twelve months was $187 billion, and it was operationally profitable with $13 billion in operating profits and net income of $6 billion. That said, if you seek upside with lower volatility than individual stocks, the Trefis High-Quality portfolio presents an alternative, having outperformed the S&P 500 and generated returns exceeding 91% since its inception.
See earnings reaction history of all stocks
General Motors’ Historical Odds Of Positive Post-Earnings Return
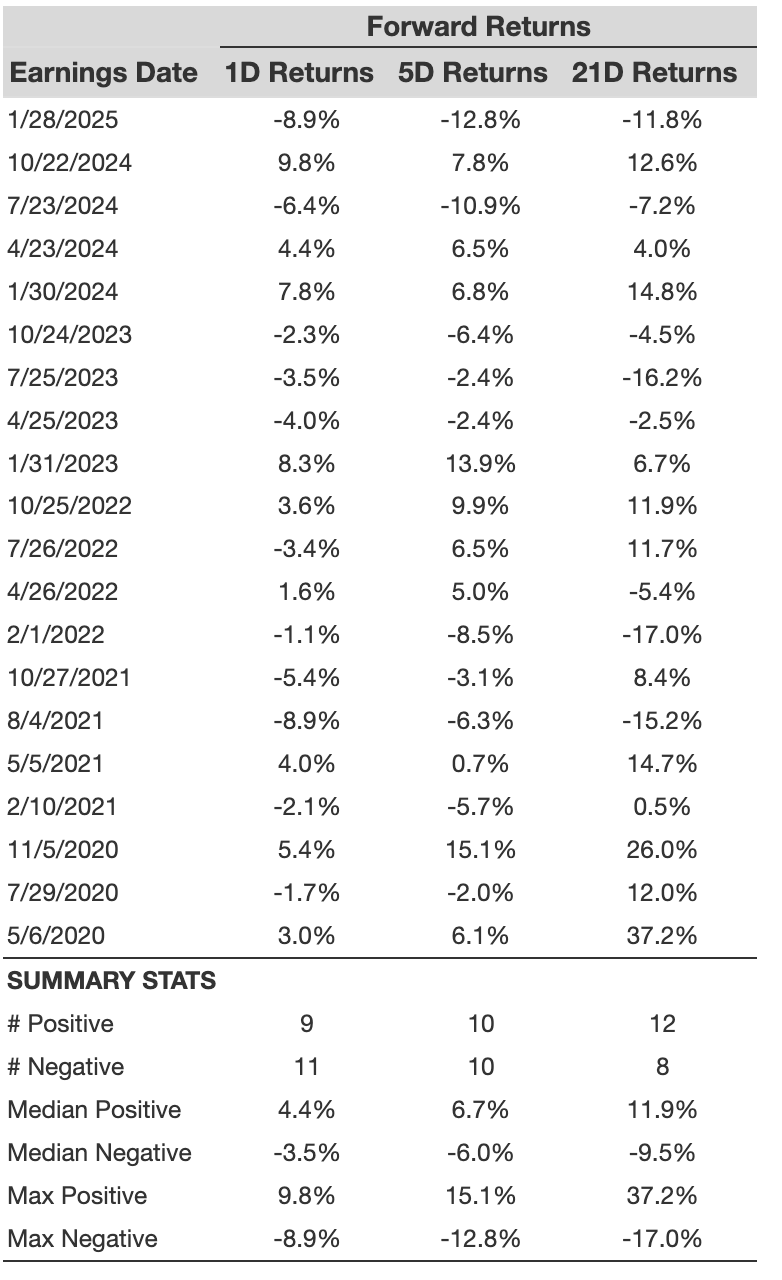
Some observations on one-day (1D) post-earnings returns:
- There are 20 earnings data points recorded over the last five years, with 9 positive and 11 negative one-day (1D) returns observed. In summary, positive 1D returns were seen about 45% of the time.
- Notably, this percentage increases to 50% if we consider data for the last 3 years instead of 5.
- Median of the 9 positive returns = 4.4%, and median of the 11 negative returns = -3.5%
Additional data for observed 5-Day (5D), and 21-Day (21D) returns post earnings are summarized along with the statistics in the table below.
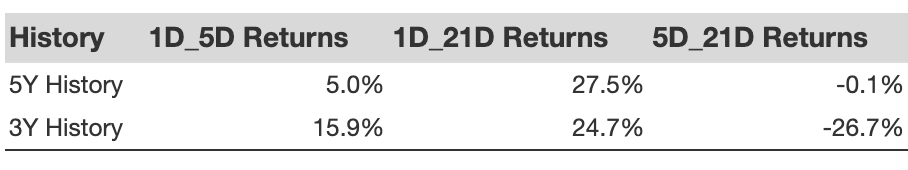
A relatively less risky strategy (though not useful if the correlation is low) is to understand the correlation between short-term and medium-term returns post earnings, find a pair that has the highest correlation, and execute the appropriate trade. For example, if 1D and 5D show the highest correlation, a trader can position themselves “long” for the next 5 days if 1D post-earnings return is positive. Here is some correlation data based on 5-year and 3-year (more recent) history. Note that the correlation 1D_5D refers to the correlation between 1D post-earnings returns and subsequent 5D returns.
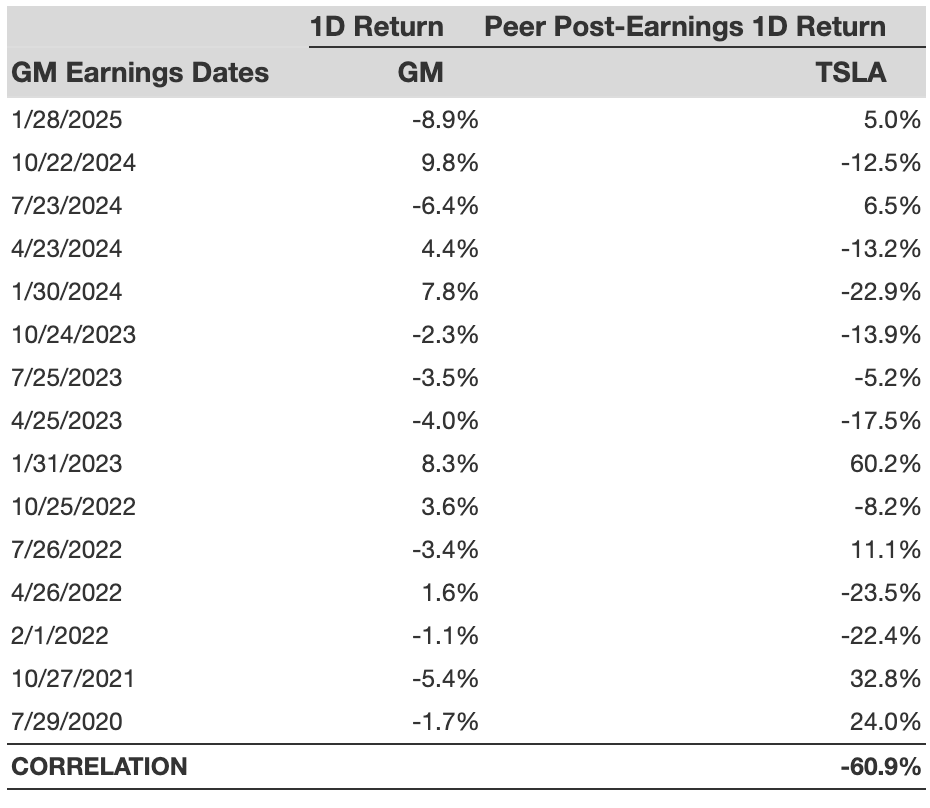
Is There Any Correlation With Peer Earnings?
Sometimes, peer performance can have influence on post-earnings stock reaction. In fact, the pricing-in might begin before the earnings are announced. Here is some historical data on the past post-earnings performance of General Motors stock compared with the stock performance of peers that reported earnings just before General Motors. For fair comparison, peer stock returns also represent post-earnings one-day (1D) returns.
Learn more about Trefis RV strategy that has outperformed its all-cap stocks benchmark (combination of all 3, the S&P 500, S&P mid-cap, and Russell 2000), to produce strong returns for investors. Separately, if you want upside with a smoother ride than an individual stock like General Motors, consider the High Quality portfolio, which has outperformed the S&P, and clocked >91% returns since inception.
Invest with Trefis Market Beating Portfolios
See all Trefis Price Estimates