How Will GE Perform In Q1?
General Electric (NASDAQ: GE) is expected to publish its Q1 2018 results on April 20, reporting on what is likely to be another mixed quarter for the company. Over Q4 2017, the Power segment revenues declined by about 15% year-over-year, and it’s possible that the trend will continue in Q1, although the magnitude of the declines should be lower. Further, a $4.2 billion equity charge is expected to dampen the Q1 earnings. In addition, a change in accounting standards will likely result in slightly lower overall revenue. Below, we take a look at what to expect when the company reports earnings.


We have a price a $17 price estimate for General Electric, which is higher than the current market price. The charts have been made using our new, interactive platform. You can click here to modify the different driver assumptions, and gauge their impact on the earnings and price per share metrics.
The Aviation segment had a strong year in 2017, as margins improved as a result of increased delivery of cost-efficient LEAP engines. We expect the segment’s tailwinds to carry into 2018 and drive segment revenue to nearly $28 billion (+ 4% y-o-y) driven by strong growth in the Military business and the delivery of 1200 LEAP engines by 2018 end. In addition, GE’s Additive and Digital business should provide long term growth opportunities.

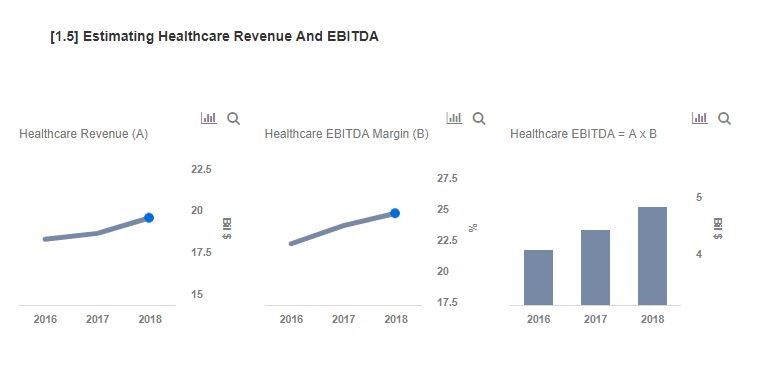
The Healthcare segment had a strong year in 2017, driven by strong growth in emerging markets. On a product basis, ultrasound and imaging products experienced strong growth. We expect this trend to continue into 2018, driven by strong demand in emerging markets. In addition, the possible advancement of technology based smart healthcare should prove pivotal and provide for significant long term growth.

The market for high-end gas turbines has been fairly weak, largely due to the growth of renewable energy, and GE expects challenging power markets to continue into 2018. We expect the 2018 revenue in this segment to decline by nearly 4% to $33.8 billion.
What’s behind Trefis? See How it’s Powering New Collaboration and What-Ifs
For CFOs and Finance Teams | Product, R&D, and Marketing Teams
More Trefis Research
Like our charts? Explore example interactive dashboards and create your own
