How Will Freeport-McMoRan Stock React To Its Upcoming Earnings?

Freeport-McMoRan (NYSE:FCX) is set to report its earnings on Thursday, April 24, 2025.
The company has $47 Bil in current market capitalization. Revenue over the last twelve months was $25 Bil, and it was operationally profitable with $6.9 Bil in operating profits and net income of $1.9 Bil. That said, if you seek upside with lower volatility than individual stocks, the Trefis High-Quality portfolio presents an alternative – having outperformed the S&P 500 and generated returns exceeding 91% since its inception.
See earnings reaction history of all stocks
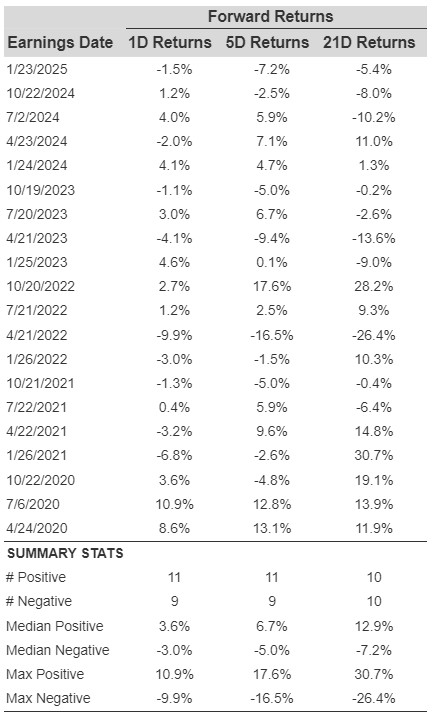
Freeport-McMoRan’s Historical Odds Of Positive Post-Earnings Return
- Freeport-McMoRan Stock Surged 70%, Here’s Why
- What’s Next for Freeport Stock?
- Copper’s Rally Reveals a Deeper Supply-Demand Imbalance
- What’s Happening With Freeport Stock?
- How Will Freeport-McMoRan Stock React To Its Upcoming Earnings?
- Freeport-McMoRan Stock Rockets 11% as Momentum Builds With 5-Day Streak
Some observations on one-day (1D) post-earnings returns:
- There are 20 earnings data points recorded over the last five years, with 11 positive and 9 negative one-day (1D) returns observed. In summary, positive 1D returns were seen about 55% of the time.
- Notably, this percentage increases to 64% if we consider data for the last 3 years instead of 5.
- Median of the 11 positive returns = 3.6%, and median of the 9 negative returns = -3.0%
Additional data for observed 5-Day (5D), and 21-Day (21D) returns post earnings are summarized along with the statistics in the table below.
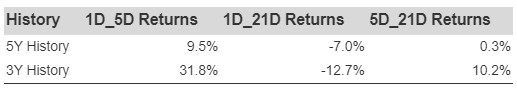
Correlation Between 1D, 5D, and 21D Historical Returns A relatively less risky strategy (though not useful if the correlation is low) is to understand the correlation between short-term and medium-term returns post earnings, find a pair that has the highest correlation, and execute the appropriate trade. For example, if 1D and 5D show the highest correlation, a trader can position themselves “long” for the next 5 days if 1D post-earnings return is positive. Here is some correlation data based on 5-year and 3-year (more recent) history. Note that the correlation 1D_5D refers to the correlation between 1D post-earnings returns and subsequent 5D returns.
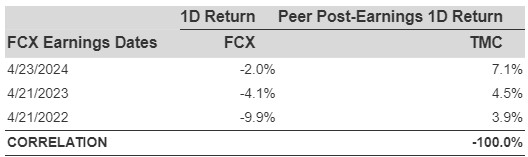
Is There Any Correlation With Peer Earnings?
Sometimes, peer performance can have influence on post-earnings stock reaction. In fact, the pricing-in might begin before the earnings are announced. Here is some historical data on the past post-earnings performance of Freeport-McMoRan stock compared with the stock performance of peers that reported earnings just before Freeport-McMoRan. For fair comparison, peer stock returns also represent post-earnings one-day (1D) returns.
Learn more about Trefis RV strategy that has outperformed its all-cap stocks benchmark (combination of all 3, the S&P 500, S&P mid-cap, and Russell 2000), to produce strong returns for investors. Separately, if you want upside with a smoother ride than an individual stock like Freeport-McMoRan, consider the High Quality portfolio, which has outperformed the S&P, and clocked >91% returns since inception.
Invest with Trefis Market Beating Portfolios
See all Trefis Price Estimates