How Will Ford Motor Stock React To Its Upcoming Earnings?

Ford Motor (NYSE:F) is set to report its earnings on May 5, 2025. Consensus projects earnings of about $0.01 per share, down from $0.49 per share in the year-ago quarter, while revenues are likely to come in at about $35.3 billion, down 11.6% compared to the last year. Ford has already reported its vehicle delivery numbers for the U.S. for Q1, noting a 1.3% year-over-year decline, due to the discontinuation of some models as well as the timing of certain rental fleet sales. In comparison, Ford’s principal rival GM reported 17% year-over-year growth in U.S. sales for Q1 2025. However, Ford’s sales of pickup trucks such as the Maverick, Ranger, and F-Series rose 25% and this is likely to have helped soften the impact on margins and profitability.
The company has $38 billion in current market capitalization. Revenue over the last twelve months was $185 Bil, and it was operationally profitable with $5.2 Bil in operating profits and net income of $5.9 billion. That said, if you seek upside with lower volatility than individual stocks, the Trefis High-Quality portfolio presents an alternative, having outperformed the S&P 500 and generated returns exceeding 91% since its inception.
See earnings reaction history of all stocks
Ford Motor’s Historical Odds Of Positive Post-Earnings Return
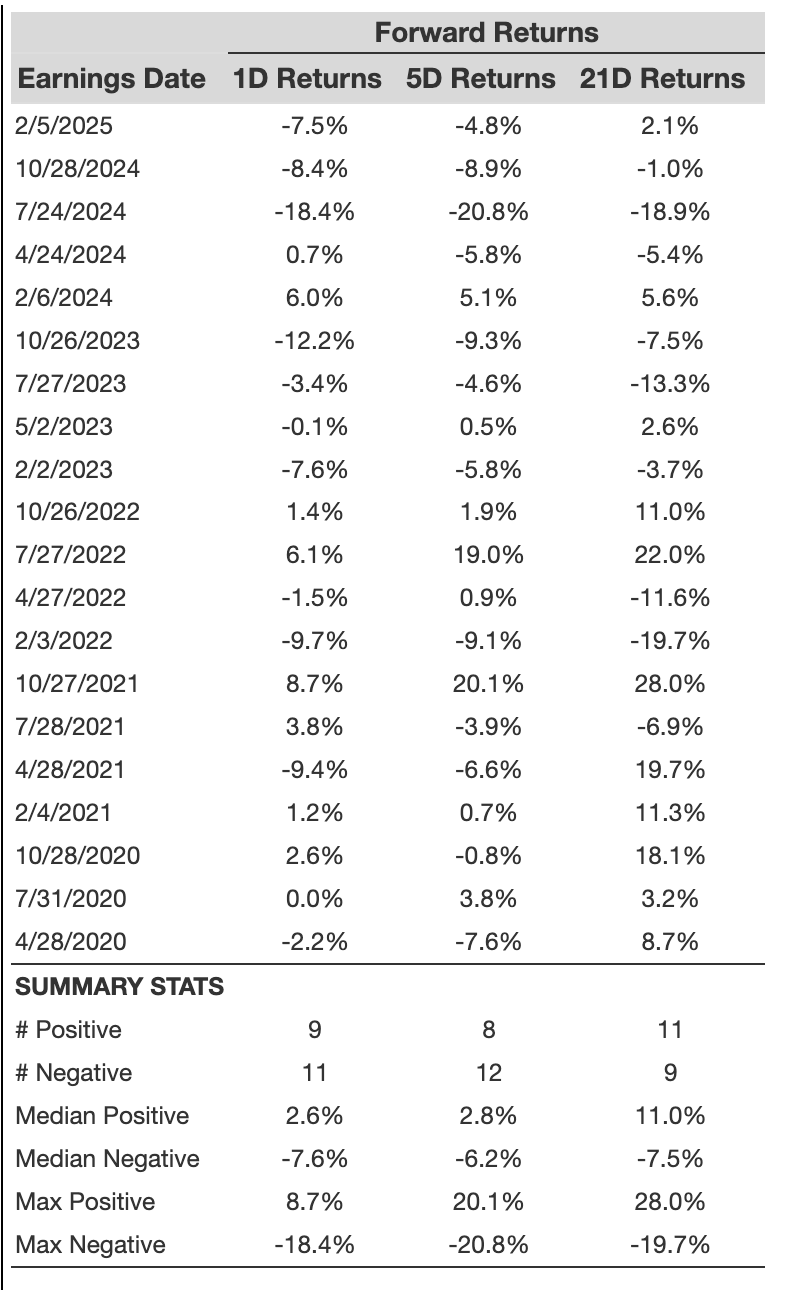
Some observations on one-day (1D) post-earnings returns:
- There are 20 earnings data points recorded over the last five years, with 9 positive and 11 negative one-day (1D) returns observed. In summary, positive 1D returns were seen about 45% of the time.
- However, this percentage decreases to 33% if we consider data for the last 3 years instead of 5.
- Median of the 9 positive returns = 2.6%, and median of the 11 negative returns = -7.6%
Additional data for observed 5-Day (5D), and 21-Day (21D) returns post earnings are summarized along with the statistics in the table below.
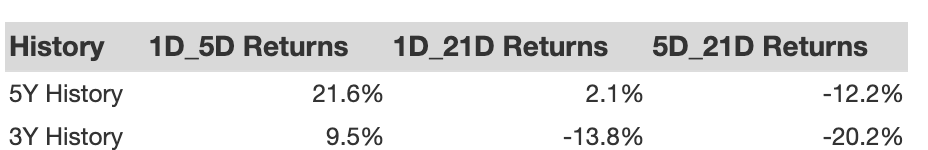
Correlation Between 1D, 5D, and 21D Historical Returns
A relatively less risky strategy (though not useful if the correlation is low) is to understand the correlation between short-term and medium-term returns post earnings, find a pair that has the highest correlation, and execute the appropriate trade. For example, if 1D and 5D show the highest correlation, a trader can position themselves “long” for the next 5 days if the 1D post-earnings return is positive. Here is some correlation data based on a 5-year and a 3-year (more recent) history. Note that the correlation 1D_5D refers to the correlation between 1D post-earnings returns and subsequent 5D returns.
Learn more about Trefis RV strategy that has outperformed its all-cap stocks benchmark (combination of all 3, the S&P 500, S&P mid-cap, and Russell 2000), to produce strong returns for investors. Separately, if you want upside with a smoother ride than an individual stock like Ford Motor, consider the High Quality portfolio, which has outperformed the S&P, and clocked >91% returns since inception.
Invest with Trefis Market Beating Portfolios
See all Trefis Price Estimates