Estée Lauder Earnings Preview: Will the Stock Drop Again?

Estée Lauder Companies (NYSE:EL) is scheduled to announce its earnings on Thursday, May 1, 2025. Event-driven traders might find historical patterns insightful for potential trading strategies. Estée Lauder’s stock has exhibited negative one-day returns following earnings announcements in 70% of the instances over the past five years. The median negative one-day return during these events was -7.3%, with the largest single-day drop reaching -20.9%.
Traders can potentially leverage these historical tendencies in two ways: first, by understanding the historical probability of negative returns and positioning themselves before the earnings release. Second, they can analyze the correlation between immediate post-earnings returns and medium-term performance to inform trading decisions after the announcement.
The upcoming earnings report for Estée Lauder is anticipated to show a decline compared to the same quarter last year. Consensus estimates predict earnings per share of $0.31 on sales of $3.51 billion, down from $0.97 per share on sales of $3.94 billion in the year-ago quarter. This anticipated decline is largely attributed to reduced demand in mainland China and challenges within its global travel retail business, both of which are expected to negatively impact Estée Lauder’s Q3 performance.
From a fundamental perspective, Estée Lauder currently has a market capitalization of $21 billion. Over the last twelve months, it generated $15 billion in revenue and $1.5 billion in operating profit. However, its net income for the same period was $-700 million.
- Should Estee Lauder Stock Investors Panic?
- Estee Lauder Companies Stock To $66?
- Better Value & Growth: PG Leads Estee Lauder Companies Stock
- PG Tops Estee Lauder Companies Stock on Price & Potential
- Stronger Bet Than Estee Lauder Companies Stock: PG Delivers More
- Pay Less, Gain More: PG Tops Estee Lauder Companies Stock
In summary, while the actual market reaction to Estée Lauder’s earnings will depend on how the results compare to expectations, understanding both the historical post-earnings stock behavior and the current fundamental challenges could offer valuable context for event-driven trading strategies.
If you seek upside with lower volatility than individual stocks, the Trefis High Quality portfolio presents an alternative – having outperformed the S&P 500 and generated returns exceeding 91% since its inception.
See earnings reaction history of all stocks

Image by Thảo Trần Thị Thanh from Pixabay
Estée Lauder Companies’ Historical Odds Of Positive Post-Earnings Return
Some observations on one-day (1D) post-earnings returns:
- There are 20 earnings data points recorded over the last five years, with 6 positive and 14 negative one-day (1D) returns observed. In summary, positive 1D returns were seen about 30% of the time.
- However, this percentage decreases to 17% if we consider data for the last 3 years instead of 5.
- Median of the 6 positive returns = 3.4%, and median of the 14 negative returns = -7.3%
Additional data for observed 5-Day (5D), and 21-Day (21D) returns post earnings are summarized along with the statistics in the table below.
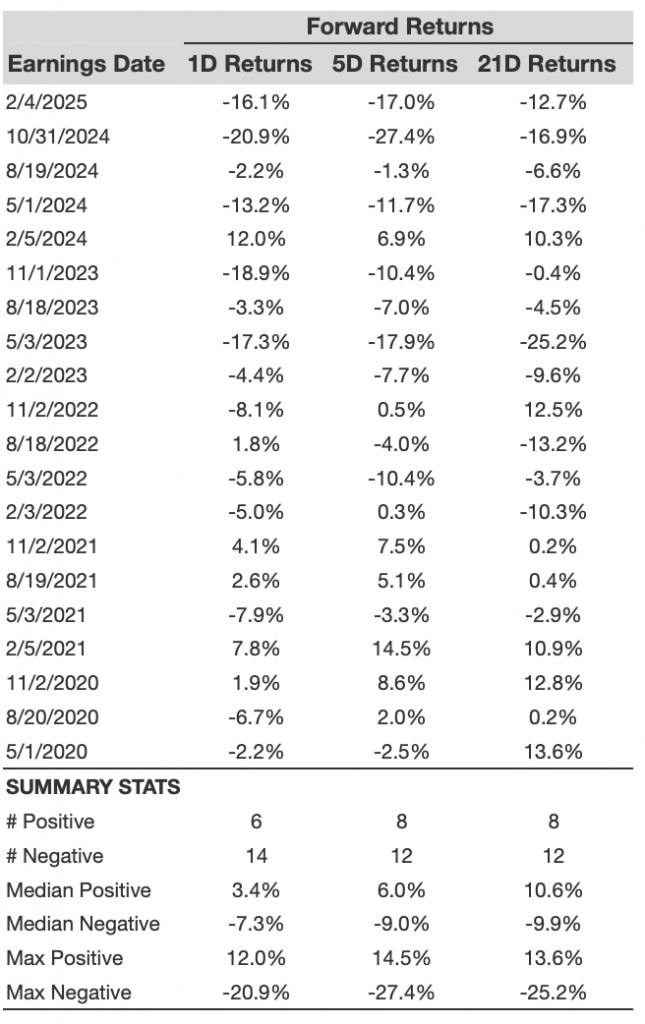
EL 1D, 5D, and 21D Post-Earnings Return
Correlation Between 1D, 5D, and 21D Historical Returns
A relatively less risky strategy (though not useful if the correlation is low) is to understand the correlation between short-term and medium-term returns post earnings, find a pair that has the highest correlation, and execute the appropriate trade. For example, if 1D and 5D show the highest correlation, a trader can position themselves “long” for the next 5 days if 1D post-earnings return is positive. Here is some correlation data based on 5-year and 3-year (more recent) history. Note that the correlation 1D_5D refers to the correlation between 1D post-earnings returns and subsequent 5D returns.
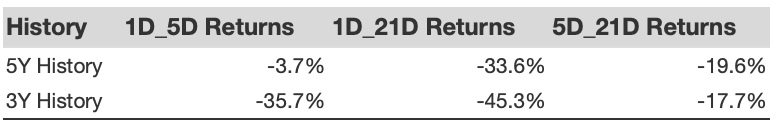
EL Correlation Between 1D, 5D and 21D Historical Returns
Is There Any Correlation With Peer Earnings?
Sometimes, peer performance can have influence on post-earnings stock reaction. In fact, the pricing-in might begin before the earnings are announced. Here is some historical data on the past post-earnings performance of Estée Lauder Companies stock compared with the stock performance of peers that reported earnings just before Estée Lauder Companies. For fair comparison, peer stock returns also represent post-earnings one-day (1D) returns.
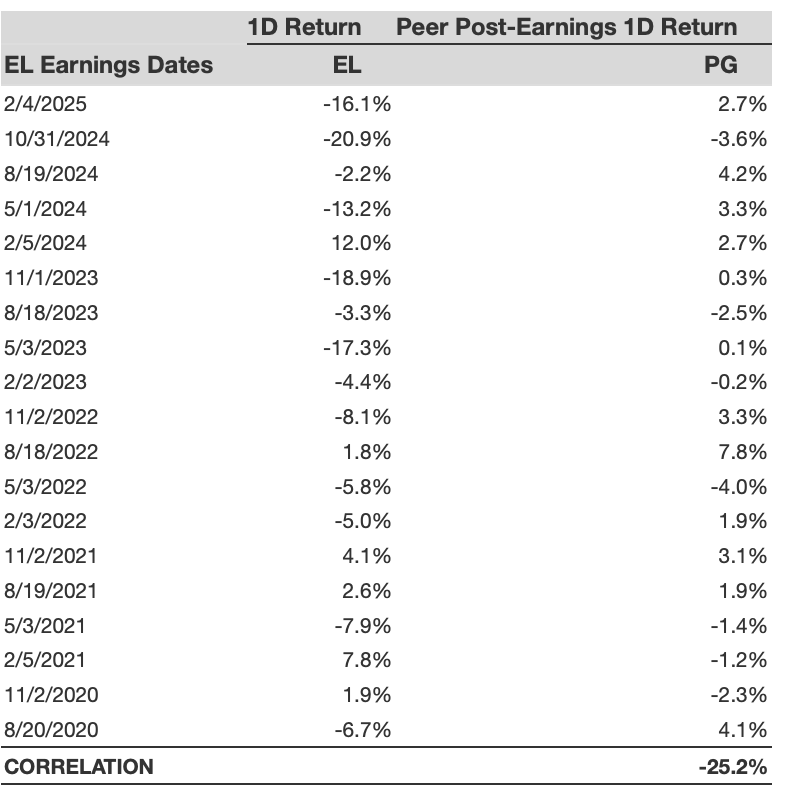
EL Correlation With Peer Earnings
Learn more about Trefis RV strategy that has outperformed its all-cap stocks benchmark (combination of all 3, the S&P 500, S&P mid-cap, and Russell 2000), to produce strong returns for investors. Separately, if you want upside with a smoother ride than an individual stock like Estée Lauder Companies, consider the High Quality portfolio, which has outperformed the S&P, and clocked >91% returns since inception.
Invest with Trefis Market-Beating Portfolios
See all Trefis Price Estimates