How DOCU Stock Might React To Upcoming Earnings?

Document signing software player Docusign (NASDAQ:DOCU) is set to report its earnings on Thursday, March 13, 2025. The consensus forecast is for earnings of $0.85 per share on $761 million in sales, showing a 12% year-over-year growth in earnings and a 7% year-over-year increase in sales. Growth is likely to be driven by the company’s Intelligent Agreement Management (IAM) platform, which uses artificial intelligence to optimize the lifecycle of agreements and contracts within an organization. Docusign has $16 billion in current market capitalization. Revenue over the last twelve months was $2.9 billion, and it was operationally profitable with $179 million in operating profits and a net income of $1.0 billion. While a lot will depend on how results stack up against consensus and expectations, understanding historical patterns might just turn the odds in your favor if you are an event-driven trader. There are two ways to do that: understand the historical odds and position yourself prior to the earnings release, or look at the correlation between immediate and medium-term returns post-earnings and position yourself accordingly after the earnings are released.
The technology sector has encountered significant volatility, with DOCU stock declining more than 5% in the last five trading days. Notably, industry heavyweight Nvidia also experienced a roughly 9% decline during the same period. These declines are symptomatic of a broader market sell-off triggered by President Trump’s tariff announcements. This market turbulence culminated in the broader markets falling over 2% in the last five days. Our take on market crash risk right now has more details on how tariffs could impact the broader markets.
See earnings reaction history of all stocks
Docusign’s Historical Odds Of Positive Post-Earnings Return
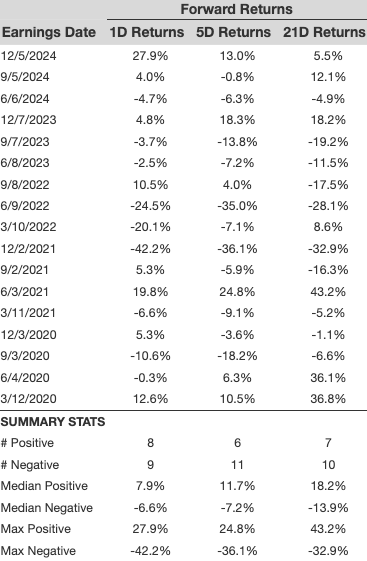
Some observations on one-day (1D) post-earnings returns:
- There are 17 earnings data points recorded over the last five years, with 8 positive and 9 negative one-day (1D) returns observed. In summary, positive 1D returns were seen about 47% of the time.
- Notably, this percentage increases to 50% if we consider data for the last 3 years instead of 5.
- Median of the 8 positive returns = 7.9%, and median of the 9 negative returns =-6.6%
Additional data for observed 5-Day (5D), and 21-Day (21D) returns post earnings are summarized along with the statistics in the table below:
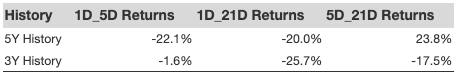
Correlation Between 1D, 5D, and 21D Historical Returns
A relatively less risky strategy (though not useful if the correlation is low) is to understand the correlation between short-term and medium-term returns post-earnings, find a pair that has the highest correlation, and execute the appropriate trade. For example, if 1D and 5D show the highest correlation, a trader can position themselves “long” for the next 5 days if 1D post-earnings return is positive. Here is some correlation data based on 5-year and 3-year (more recent) history. Note that the correlation 1D_5D refers to the correlation between 1D post-earnings returns and subsequent 5D returns.
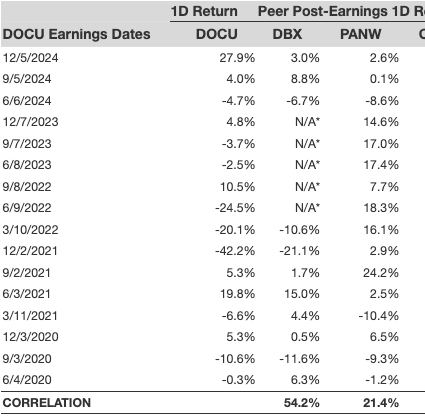
Is There Any Correlation With Peer Earnings?
Sometimes, peer performance can have an influence on post-earnings stock reaction. In fact, the pricing-in might begin before the earnings are announced. Here is some historical data on the past post-earnings performance of Docusign stock compared with the stock performance of peers that reported earnings just before Docusign. For fair comparison, peer stock returns also represent post-earnings one-day (1D) returns.
Learn more about Trefis RV strategy that has outperformed its all-cap stocks benchmark (combination of all 3, the S&P 500, S&P mid-cap, and Russell 2000), to produce strong returns for investors. Separately, if you want upside with a smoother ride than an individual stock like Docusign, consider the High Quality portfolio, which has outperformed the S&P, and clocked >91% returns since inception.
| Returns | Mar 2025 MTD [1] |
2025 YTD [1] |
2017-25 Total [2] |
| DOCU Return | -4% | -11% | 99% |
| S&P 500 Return | -3% | -2% | 158% |
| Trefis Reinforced Value Portfolio | -4% | -5% | 643% |
[1] Returns as of 3/10/2025
[2] Cumulative total returns since the end of 2016
Market Beating Portfolios | Rules-Based Wealth