Will Q2 Results Lift DR Horton Stock?

DR Horton (NYSE:DHI), an American home construction company, is set to report its fiscal second-quarter earnings on Thursday, April 17, 2025. Analysts predict the company will report earnings of $2.67 per share on $8.03 billion in sales. This would represent a 24% decline in earnings and a 12% fall in sales compared to the previous year’s figures of $3.52 per share and $9.11 billion, respectively. Historically, the stock has increased following earnings 58% of the time, with a median one-day rise of 3.0% and a maximum growth of 10%.
D.R. Horton’s 21% drop in sales order backlog in the last (Q1) quarter may signal pressure on future revenue. Navigating this alongside market competition and economic headwinds will be key to sustaining growth in the coming quarters. The company has $38 billion in current market capitalization. Revenue over the last twelve months was $37 billion, and it was operationally profitable with $5.8 billion in operating profits and net income of $4.7 billion. While a lot will depend on how results stack up against consensus and expectations, understanding historical patterns might turn the odds in your favor if you are an event-driven trader.
For event-driven traders, historical patterns may offer an edge, whether by positioning ahead of earnings or reacting to post-release moves. That said, if you seek upside with lower volatility than individual stocks, the Trefis High-Quality portfolio presents an alternative, having outperformed the S&P 500 and generated returns exceeding 91% since its inception. See earnings reaction history of all stocks.

Image by Paul Brennan from Pixabay
- How Will UFPI Stock React To Its Upcoming Earnings?
- Will The Macroeconomic Factors Continue To Weigh On PepsiCo Stock?
- If You Don’t Invest In TransDigm Group, You Are Leaving Money On The Table
- How Will Roku Stock React To Its Upcoming Earnings?
- How Will Southwest Airlines Stock React To Its Upcoming Earnings?
- What’s Next For Intuitive Surgical Stock After An Upbeat Q1?
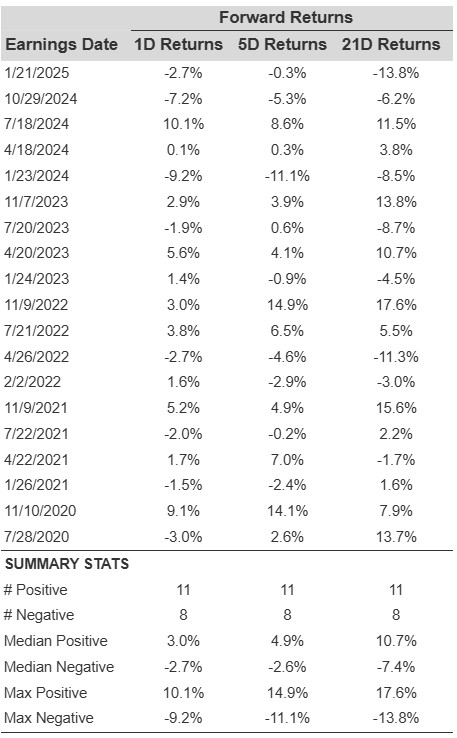
DR Horton’s Historical Odds Of Positive Post-Earnings Return
Some observations on one-day (1D) post-earnings returns:
- There are 19 earnings data points recorded over the last five years, with 11 positive and 8 negative one-day (1D) returns observed. In summary, positive 1D returns were seen about 58% of the time.
- Notably, this percentage remains at 58% if we consider data for the last 3 years instead of 5.
- Median of the 11 positive returns = 3.0%, and median of the 8 negative returns = -2.7%
Additional data for observed 5-Day (5D), and 21-Day (21D) returns post earnings are summarized along with the statistics in the table below.
Correlation Between 1D, 5D, and 21D Historical Returns
A relatively less risky strategy (though not useful if the correlation is low) is to understand the correlation between short-term and medium-term returns post earnings, find a pair that has the highest correlation, and execute the appropriate trade. For example, if 1D and 5D show the highest correlation, a trader can position themselves “long” for the next 5 days if 1D post-earnings return is positive. Here is some correlation data based on 5-year and 3-year (more recent) history. Note that the correlation 1D_5D refers to the correlation between 1D post-earnings returns and subsequent 5D returns.

DHI Correlation Between 1D, 5D and 21D Historical Returns
Learn more about Trefis RV strategy that has outperformed its all-cap stocks benchmark (combination of all 3, the S&P 500, S&P mid-cap, and Russell 2000), to produce strong returns for investors.
Invest with Trefis Market-Beating Portfolios