How Will Crown Castle Stock React To Its Upcoming Earnings?

Crown Castle (NYSE:CCI) a REIT focused on owning telecommunications infrastructure in the U.S., is set to report its earnings on Wednesday, March 12, 2025. The company’s assets, which include cell towers, small cells, and fiber-optic networks, are key to supporting 5G wireless communications in the U.S. Consensus forecast is for earnings of $0.40 per share, down from $0.86 in the year-ago period, while revenues are estimated at $1.64 billion in sales, down 2% compared to last year. Growth is likely to slow, amid easing capital spending by the major U.S. wireless carriers on their 5G networks. The company has $43 billion in current market capitalization. Revenue over the last twelve months was $6.6 Bil, and it was operationally profitable with $2.3 Bil in operating profits and a net income of $1.2 billion. While a lot will depend on how results stack up against consensus and expectations, understanding historical patterns might just turn the odds in your favor if you are an event-driven trader. There are two ways to do that: understand the historical odds and position yourself prior to the earnings release, or look at the correlation between immediate and medium-term returns post earnings and position yourself accordingly after the earnings are released.
See earnings reaction history of all stocks
Crown Castle’s Historical Odds Of Positive Post-Earnings Return
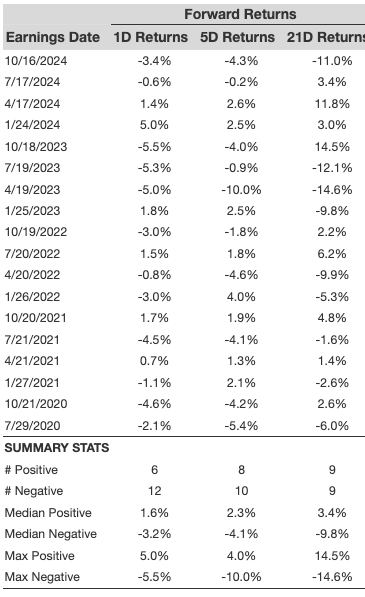
Some observations on one-day (1D) post-earnings returns:
- Buy or Wait on Booking Holdings?
- How Will NYT Stock React To Its Upcoming Q1 Earnings?
- How Might Wynn Resorts Stock Move Post Q1 Earnings?
- How Will Cleveland-Cliffs Stock React To Its Upcoming Earnings?
- How Will Electronic Arts Stock React To Its Upcoming Earnings?
- How Will Arista Networks Stock React To Its Upcoming Earnings?
- There are 18 earnings data points recorded over the last five years, with 6 positive and 12 negative one-day (1D) returns observed. In summary, positive 1D returns were seen about 33% of the time.
- Notably, this percentage increases to 36% if we consider data for the last 3 years instead of 5.
- Median of the 6 positive returns = 1.6%, and median of the 12 negative returns =-3.2%
Additional data for observed 5-Day (5D), and 21-Day (21D) returns post earnings are summarized along with the statistics in the table below.
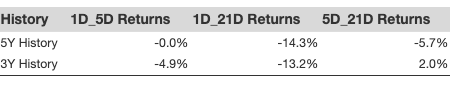
Correlation Between 1D, 5D, and 21D Historical Returns
A relatively less risky strategy (though not useful if the correlation is low) is to understand the correlation between short-term and medium-term returns post earnings, find a pair that has the highest correlation, and execute the appropriate trade. For example, if 1D and 5D show the highest correlation, a trader can position themselves “long” for the next 5 days if 1D post-earnings return is positive. Here is some correlation data based on 5-year and 3-year (more recent) history. Note that the correlation 1D_5D refers to the correlation between 1D post-earnings returns and subsequent 5D returns.
Learn more about Trefis RV strategy that has outperformed its all-cap stocks benchmark (combination of all 3, the S&P 500, S&P mid-cap, and Russell 2000), to produce strong returns for investors. Separately, if you want upside with a smoother ride than an individual stock like Crown Castle, consider the High Quality portfolio, which has outperformed the S&P, and clocked >91% returns since inception.
| Returns | Mar 2025 MTD [1] |
2025 YTD [1] |
2017-25 Total [2] |
| CCI Return | 5% | 9% | 57% |
| S&P 500 Return | -6% | -5% | 151% |
| Trefis Reinforced Value Portfolio | -4% | -5% | 643% |
[1] Returns as of 3/11/2025
[2] Cumulative total returns since the end of 2016
Invest with Trefis Market-Beating Portfolios
See all Trefis Price Estimates