How Will Badger Meter Stock React To Its Upcoming Q1 Earnings?

Badger Meter stock (NYSE: BMI) is the leading North American provider of water management solutions, offering flow measurement, water quality, and pressure monitoring, and analytics software that leverages its collected data. The company is set to report its fiscal first-quarter earnings on Thursday, April 17, 2025. Analysts predict the company will report earnings of $1.05 per share on $220.7 million in sales. This would represent a 12% increase in earnings and a 6% growth in sales compared to the previous year’s figures of $0.99 per share and $196.3 million, respectively. Historically, the stock has increased following earnings 60% of the time, with a median one-day rise of 7.3% and a maximum growth of 17%.
The company has $5.4 billion in current market capitalization. Revenue over the last twelve months was $827 million, and it was operationally profitable with $158 million in operating profits and net income of $125 million. While a lot will depend on how results stack up against consensus and expectations, understanding historical patterns might turn the odds in your favor if you are an event-driven trader.
For event-driven traders, historical patterns may offer an edge, whether by positioning ahead of earnings or reacting to post-release moves. That said, if you seek upside with lower volatility than individual stocks, the Trefis High-Quality portfolio presents an alternative, having outperformed the S&P 500 and generated returns exceeding 91% since its inception. See earnings reaction history of all stocks.

Image by Fernando50 from Pixabay
- Get Paid 8.6% to Buy GOOGL at a 30% Discount – Here’s How
- What Could Spark the Next Big Move In Netflix Stock
- Why Amazon.com Stock May Drop Soon
- Cash Rich, Low Price – Gartner Stock to Break Out?
- Does Johnson & Johnson Stock Have More Upside?
- Has American Water Works Stock Quietly Become a Value Opportunity?
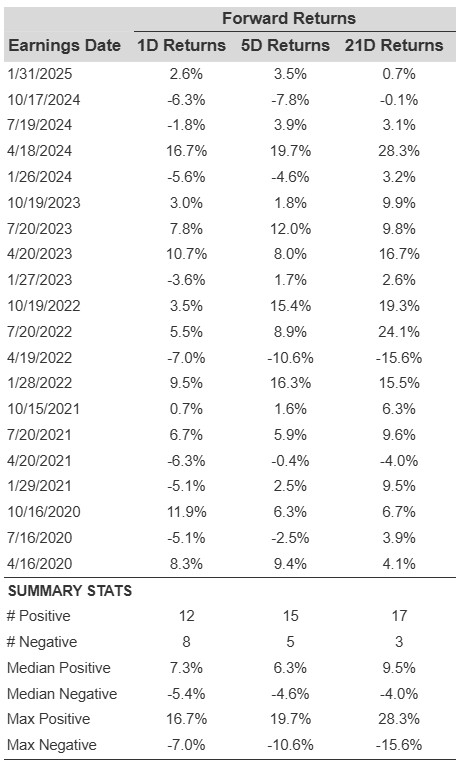
Badger Meter’s Historical Odds Of Positive Post-Earnings Return
Some observations on one-day (1D) post-earnings returns:
- There are 20 earnings data points recorded over the last five years, with 12 positive and 8 negative one-day (1D) returns observed. In summary, positive 1D returns were seen about 60% of the time.
- However, this percentage decreases to 58% if we consider data for the last 3 years instead of 5.
- Median of the 12 positive returns = 7.3%, and median of the 8 negative returns = -5.4%
Additional data for observed 5-Day (5D), and 21-Day (21D) returns post earnings are summarized along with the statistics in the table below.
Correlation Between 1D, 5D, and 21D Historical Returns
A relatively less risky strategy (though not useful if the correlation is low) is to understand the correlation between short-term and medium-term returns post earnings, find a pair that has the highest correlation, and execute the appropriate trade. For example, if 1D and 5D show the highest correlation, a trader can position themselves “long” for the next 5 days if 1D post-earnings return is positive. Here is some correlation data based on 5-year and 3-year (more recent) history. Note that the correlation 1D_5D refers to the correlation between 1D post-earnings returns and subsequent 5D returns.

BMI Correlation Between 1D, 5D and 21D Historical Returns
Learn more about Trefis RV strategy that has outperformed its all-cap stocks benchmark (combination of all 3, the S&P 500, S&P mid-cap, and Russell 2000), to produce strong returns for investors.
Invest with Trefis Market-Beating Portfolios