BlackRock Set To Report Q1 Earnings Amid Tariff Uncertainty. How Will Stock React?

BlackRock (NYSE:BLK) is set to report its earnings on Friday, April 11, 2025. The company has $127 billion in current market capitalization. Revenue over the last twelve months was $20 billion, and it was operationally profitable with $7.5 billion in operating profits and a net income of $6.4 billion. The consensus projects that revenue will grow by about 14% to $5.38 billion, while earnings are estimated to come in at about $10.52 per share. Growth is likely to be driven by higher market levels relative to the year-ago period and organic base fee growth. BlackRock’s margins have also been trending higher in recent quarters, driven by a higher mix of higher-margin, higher-fee products, including alternative investments, which have higher fees. Moreover, flows toward exchange-traded funds have also been on the uptick in recent years. While fees on these products are low, they are highly scalable, meaning that as AUMs grow, BlackRock’s incremental costs grow at a slower pace.
That said, things have been tricky for the broader U.S. equity markets over the past week after President Donald Trump announced a sweeping round of tariffs that would apply to over 100 countries. The S&P 500 lost over 10% in total over Thursday and Friday and looks set for a tough Monday as well. This could have a considerable impact on BlackRock, as lower stock market valuations impact the company’s assets under management and fees revenue. That said, the company could see opportunities with its fixed income and alternative investment offerings. BlackRock stock has corrected over 14% over the last two trading days. We will be looking for more commentary from management during the company’s earnings call. That said, if you seek upside with lower volatility than individual stocks, the Trefis High-Quality portfolio presents an alternative – having outperformed the S&P 500 and generated returns exceeding 91% since its inception.
See earnings reaction history of all stocks
BlackRock’s Historical Odds Of Positive Post-Earnings Return
Some observations on one-day (1D) post-earnings returns:
- There are 18 earnings data points recorded over the last five years, with 10 positive and 8 negative one-day (1D) returns observed. In summary, positive 1D returns were seen about 56% of the time.
- However, this percentage decreases to 50% if we consider data for the last 3 years instead of 5.
- Median of the 10 positive returns = 3.3%, and median of the 8 negative returns =-1.9%
Additional data for observed 5-Day (5D), and 21-Day (21D) returns post earnings are summarized along with the statistics in the table below.

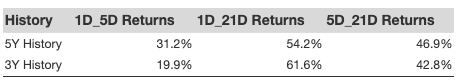
Correlation Between 1D, 5D, and 21D Historical Returns
A relatively less risky strategy (though not useful if the correlation is low) is to understand the correlation between short-term and medium-term returns post-earnings, find a pair that has the highest correlation, and execute the appropriate trade. For example, if 1D and 5D show the highest correlation, a trader can position themselves “long” for the next 5 days if the 1D post-earnings return is positive. Here is some correlation data based on a 5-year and 3-year (more recent) history. Note that the correlation 1D_5D refers to the correlation between 1D post-earnings returns and subsequent 5D returns.
Learn more about Trefis RV strategy that has outperformed its all-cap stocks benchmark (combination of all 3, the S&P 500, S&P mid-cap, and Russell 2000), to produce strong returns for investors. Separately, if you want upside with a smoother ride than an individual stock like BlackRock, consider the High Quality portfolio, which has outperformed the S&P and clocked >91% returns since inception.
| Returns | Apr 2025 MTD [1] |
2025 YTD [1] |
2017-25 Total [2] |
| BLK Return | -13% | -19% | 166% |
| S&P 500 Return | -10% | -14% | 127% |
| Trefis Reinforced Value Portfolio | -9% | -18% | 492% |
[1] Returns as of 4/7/2025
[2] Cumulative total returns since the end of 2016
Invest with Trefis Market-Beating Portfolios
See all Trefis Price Estimates