How Will Bank of New York Mellon Stock React To Its Upcoming Earnings?

Custody banking giant Bank of New York Mellon (NYSE:BK) is set to report its earnings on Friday, April 11, 2025. Consensus earnings are pegged at about $1.49 for the company, up about 16% compared to last year, while revenues are poised to grow by about 5%. Growth is likely to be driven by higher assets under custody and administration versus the previous year, as well as by cost cuts and an increasing focus on higher-margin businesses. The company has roughly $53 billion in current market capitalization. Revenue over the last twelve months was $18 billion, and it had a net income of $4.5 billion.
Things have been volatile in the U.S. markets over the past week after President Donald Trump announced a sweeping round of tariffs that would apply to over 100 countries and then paused the rollout on Thursday. The S&P 500 has lost about 10.5% since last Thursday, by rebounded by close to 9.5% on Friday. However, things look tough for the markets, as the trade war with China has only been escalating. The U.S. has imposed a 125% tax on all Chinese goods, while China announced new tariffs of 84% on all US imports. This could have a considerable impact on Bank of New York Mellon, as lower stock market valuations impact the company’s revenues as the fees it earns are based on the total value of assets it holds in custody and manages. BNY stock has declined by close to 2% over the last 5 trading days. That said, if you seek upside with lower volatility than individual stocks, the Trefis High-Quality portfolio presents an alternative – having outperformed the S&P 500 and generated returns exceeding 75% since its inception.
See earnings reaction history of all stocks
Bank of New York Mellon’s Historical Odds Of Positive Post-Earnings Return
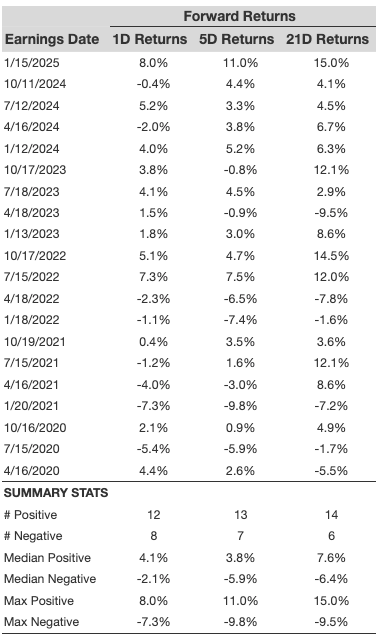
Some observations on one-day (1D) post-earnings returns:
- There are 20 earnings data points recorded over the last five years, with 12 positive and 8 negative one-day (1D) returns observed. In summary, positive 1D returns were seen about 60% of the time.
- Notably, this percentage increases to 75% if we consider data for the last 3 years instead of 5.
- Median of the 12 positive returns = 4.1%, and median of the 8 negative returns =-2.1%
Additional data for observed 5-Day (5D) and 21-Day (21D) returns post earnings are summarized along with the statistics in the table below.
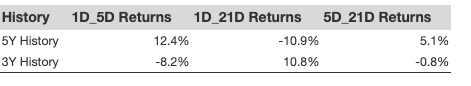
Correlation Between 1D, 5D, and 21D Historical Returns
A relatively less risky strategy (though not useful if the correlation is low) is to understand the correlation between short-term and medium-term returns post-earnings, find a pair that has the highest correlation, and execute the appropriate trade. For example, if 1D and 5D show the highest correlation, a trader can position themselves “long” for the next 5 days if the 1D post-earnings return is positive. Here is some correlation data based on a 5-year and 3-year (more recent) history. Note that the correlation 1D_5D refers to the correlation between 1D post-earnings returns and subsequent 5D returns.
Learn more about Trefis RV strategy that has outperformed its all-cap stocks benchmark (combination of all 3, the S&P 500, S&P mid-cap, and Russell 2000), to produce strong returns for investors. Separately, if you want upside with a smoother ride than an individual stock like Bank of New York Mellon, consider the High Quality portfolio, which has outperformed the S&P and clocked >75% returns since inception.
Invest with Trefis Market-Beating Portfolios
See all Trefis Price Estimates