Best Buy Beats Q1 Estimates On Higher Comparable Sales
Best Buy(NYSE:BBY) announced better-than-expected first quarter results on Thursday, as both its revenue and earnings per share came in ahead of market expectations. However, the stock still fell as the retailer’s aggressive push to keep up with Amazon led to shrinking margins, while its online sales growth slowed a bit. Still, Best Buy has been executing on its strategy to cut costs, optimize square footage, grow online sales and stabilize its revenue streams. We have created an Interactive Dashboard which outlines the company’s Q1 performance and our expectations for its Q2 and fiscal 2019 results. You can modify our forecasts to see the impact any changes would have on the company’s earnings and valuation.
In Q1, Best Buy’s revenue grew 7% year-over-year (y-o-y) to around $9.1 billion, largely due to an enterprise comparable sales increase of 7.1%, which beat expectations easily. The company benefited from stronger consumer demand across all major categories, particularly appliances, computer and mobile phone categories. The retailer’s online sales grew 12% on a comparable basis to $1.14 billion, primarily due to higher average order values. Best Buy also reported non-GAAP EPS of $0.82 in this quarter, up 37% y-o-y, primarily driven by a lower effective tax rate and a higher domestic revenue. The company’s SG&A costs grew 6% y-o-y, due to increases in growth investments, higher incentive compensation expenses, and higher variable costs due to increased revenue.
Best Buy U.S. Continues To Grow
- With Q2 Earnings Around The Corner, Will Best Buy Stock Live Up To Its Name?
- Down 7% This Year, Will Best Buy Stock Recover Following Q1 Results?
- Flat Since The Beginning of 2023, What’s Next For Best Buy’s Stock Post Q4 Results?
- Down 15% This Year, Where Is Best Buy Stock Headed Post Q3?
- What To Expect From Best Buy’s Stock Post Q2?
- What’s Happening With Best Buy’s Stock?
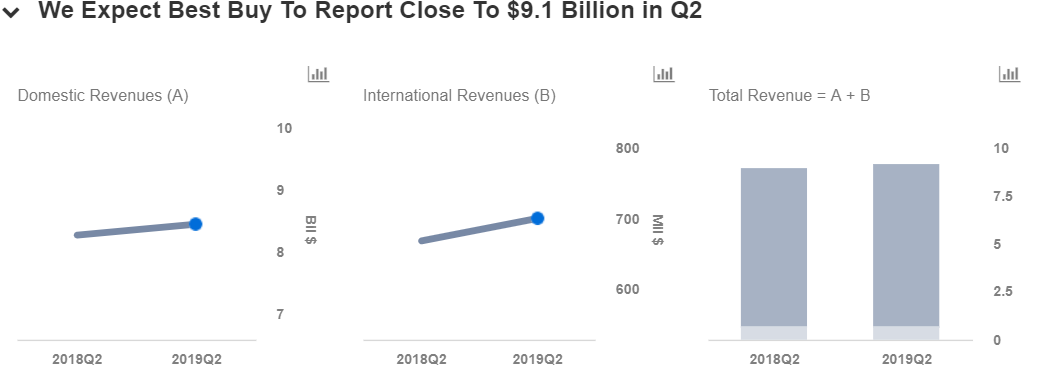
Best Buy’s domestic segment’s revenue increased 13% y-o-y to $8.4 billion, as domestic comparable sales grew 7.1%, partially offset by the loss of revenue from the closure of 17 large-format stores and 193 Best Buy mobile stores. From a merchandising perspective, the company saw positive comps across most of its product categories, with the largest drivers being mobile phones, appliances, smart home, wearables and home theater. In the international segment, the company’s revenue increased 13% y-o-y to $700 million, driven by comparable sales growth of 6.4%. This positive comparable growth was driven by growth in both Canada and Mexico.

Future Outlook
In Q2, Best Buy expects its sales to benefit from the positive category momentum of the first quarter. The company expects domestic comparable sales growth in the range of 3% to 4%, and adjusted earnings per diluted share of $0.77 to $0.82 for the company, which is an increase of 12% to 19% year-on-year. In addition, Best Buy expects its domestic segment to benefit from an extra week in the quarter compared to last year. However, the company’s margin pressure could continue due to increased investments in the supply chain as well as higher transportation costs. Also, the national rollout of Total Tech Support is expected to add approximately 25 basis points of gross profit pressure in Q2.


For the full year fiscal 2019, the company continues to expect revenue to range between $41 to $42 billion, with an enterprise comparable sales growth of flat to 2%. The retailer’s investments in specialty labor, supply chain and increased depreciation related to strategic capital investments and ongoing pressures in the business, including approximately $35 million of lower profit share revenue, will be partially offset by a combination of returns from new initiatives and ongoing cost reductions and efficiencies. In addition, the company also expects the Best Buy mobile store closures that were announced in Q4 to negatively impact full-year revenue by approximately $225 million, with flat to slightly positive impact on its operating income.


For CFOs and Finance Teams | Product, R&D, and Marketing Teams
Like our charts? Explore example interactive dashboards and create your own
