Will Amazon’s Earnings Boost Or Hurt Its Stock Price?

Amazon.com (NASDAQ:AMZN) is scheduled to release its earnings report on Thursday, May 1, 2025. For event-driven traders, understanding historical stock reactions to earnings can be valuable. Over the past five years, AMZN has experienced negative one-day returns following 60% of its earnings announcements. The median negative return during these instances was -6.1%, with the largest single-day drop reaching -14%.
Traders can potentially leverage these historical patterns in two primary ways. The first approach involves analyzing these historical odds and establishing a position in AMZN stock before the earnings release. The second strategy focuses on examining the correlation between the immediate stock reaction after earnings and its medium-term performance, allowing for post-earnings positioning.
This quarter, consensus estimates project Amazon to report earnings of $1.36 per share on revenue of $155.1 billion. This represents a significant increase compared to the same quarter last year, which saw earnings of $0.98 per share on sales of $143.3 billion. Amazon Web Services (AWS) is expected to be the primary driver of this revenue growth. However, the company anticipates a negative impact of approximately $2 billion due to foreign currency translation headwinds during the quarter.
From a fundamental perspective, Amazon currently holds a market capitalization of $2.0 trillion. Its revenue over the trailing twelve months stands at $638 billion, and the company has demonstrated operational profitability with $69 billion in operating profits and a net income of $59 billion.
That said, if you seek upside with lower volatility than individual stocks, the Trefis High Quality portfolio presents an alternative – having outperformed the S&P 500 and generated returns exceeding 91% since its inception.
See earnings reaction history of all stocks

Image by Preis_King from Pixabay
Amazon’s Historical Odds Of Positive Post-Earnings Return
Some observations on one-day (1D) post-earnings returns:
- There are 20 earnings data points recorded over the last five years, with 8 positive and 12 negative one-day (1D) returns observed. In summary, positive 1D returns were seen about 40% of the time.
- Notably, this percentage increases to 55% if we consider data for the last 3 years instead of 5.
- Median of the 8 positive returns = 7.3%, and median of the 12 negative returns = -6.1%
Additional data for observed 5-Day (5D), and 21-Day (21D) returns post earnings are summarized along with the statistics in the table below.

AMZN 1D, 5D, and 21D Post Earnings Return
Correlation Between 1D, 5D, and 21D Historical Returns
A relatively less risky strategy (though not useful if the correlation is low) is to understand the correlation between short-term and medium-term returns post earnings, find a pair that has the highest correlation, and execute the appropriate trade. For example, if 1D and 5D show the highest correlation, a trader can position themselves “long” for the next 5 days if 1D post-earnings return is positive. Here is some correlation data based on 5-year and 3-year (more recent) history. Note that the correlation 1D_5D refers to the correlation between 1D post-earnings returns and subsequent 5D returns.
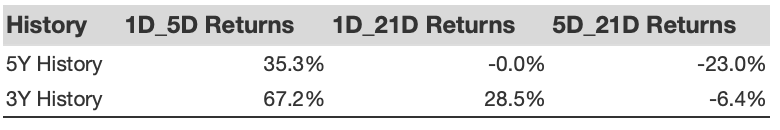
AMZN Correlation Between 1D, 5D and 21D Historical Returns
Learn more about Trefis RV strategy that has outperformed its all-cap stocks benchmark (combination of all 3, the S&P 500, S&P mid-cap, and Russell 2000), to produce strong returns for investors. Separately, if you want upside with a smoother ride than an individual stock like Amazon.com, consider the High Quality portfolio, which has outperformed the S&P, and clocked >91% returns since inception.
Invest with Trefis Market-Beating Portfolios
See all Trefis Price Estimates