How Will Apple Stock React To Its Upcoming Earnings?

Apple (NASDAQ:AAPL) is likely to report its Q2 FY’25 results in early May. Earnings are likely to trend slightly higher, to about $1.61 per share, per consensus estimates, up from $1.53 per share in the year-ago quarter, driven by higher services revenues and share repurchases.
That said, all eyes will be on Apple’s outlook, given the Trump Administration’s tariff spree and the high-stakes trade war between the United States and China. U.S. tariffs on China now stand at about 245% on some imports, although electronics, including smartphones and laptops, are exempt, though Trump indicated that the reprieve would be temporary. This could be a big setback for Apple, which, by some estimates, produces 9 out of 10 of its iPhones in China. We will be looking for clarity on how Apple intends to manage its supply chain and U.S. business in light of the current developments. We estimated that in a worst-case scenario, Apple’s earnings could decline as much as 30% due to tariffs. See How Apple Will Weather Tariff Storm
Apple has $2.9 trillion in current market capitalization. Revenue over the last twelve months was $396 Bil, and it was operationally profitable with $126 Bil in operating profits and net income of $96 billion. That said, if you seek upside with lower volatility than individual stocks, the Trefis High-Quality portfolio presents an alternative, having outperformed the S&P 500 and generated returns exceeding 91% since its inception.
See earnings reaction history of all stocks
Apple’s Historical Odds Of Positive Post-Earnings Return
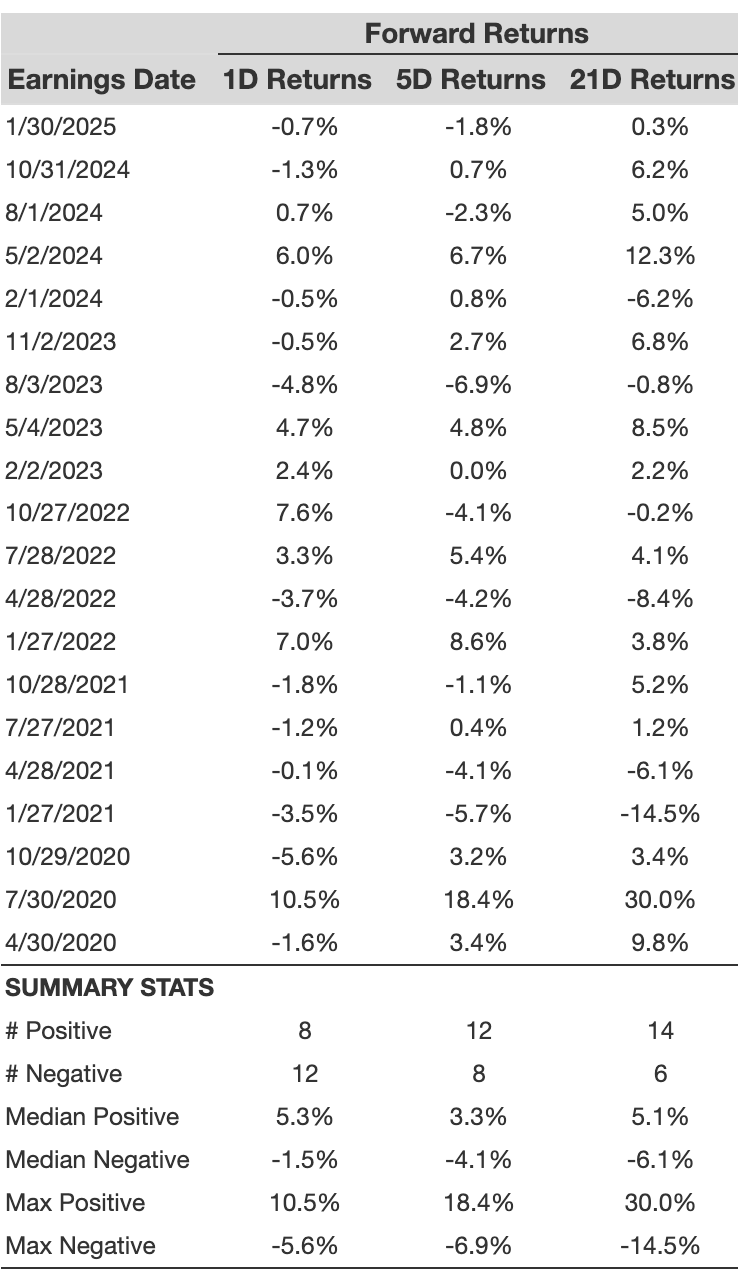
Some observations on one-day (1D) post-earnings returns:
- There are 20 earnings data points recorded over the last five years, with 8 positive and 12 negative one-day (1D) returns observed. In summary, positive 1D returns were seen about 40% of the time.
- Notably, this percentage increases to 50% if we consider data for the last 3 years instead of 5.
- Median of the 8 positive returns = 5.3%, and median of the 12 negative returns = -1.5%
Additional data for observed 5-Day (5D), and 21-Day (21D) returns post earnings are summarized along with the statistics in the table below.
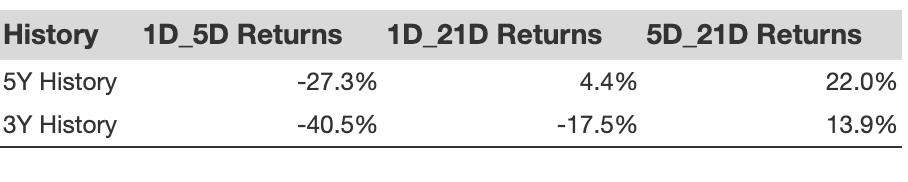
Correlation Between 1D, 5D, and 21D Historical Returns
A relatively less risky strategy (though not useful if the correlation is low) is to understand the correlation between short-term and medium-term returns post earnings, find a pair that has the highest correlation, and execute the appropriate trade. For example, if 1D and 5D show the highest correlation, a trader can position themselves “long” for the next 5 days if the 1D post-earnings return is positive. Here is some correlation data based on a 5-year and a 3-year (more recent) history. Note that the correlation 1D_5D refers to the correlation between 1D post-earnings returns and subsequent 5D returns.
Learn more about Trefis RV strategy that has outperformed its all-cap stocks benchmark (combination of all 3, the S&P 500, S&P mid-cap, and Russell 2000), to produce strong returns for investors. Separately, if you want upside with a smoother ride than an individual stock like Apple, consider the High Quality portfolio, which has outperformed the S&P, and clocked >91% returns since inception.
Invest with Trefis Market-Beating Portfolios
See all Trefis Price Estimates