How Casey’s General Stores Stock Might React To Upcoming Earnings?
Casey’s General Stores (NASDAQ:CASY), a gas station and convenience store chain, is set to report its earnings on Wednesday, March 12, 2025. The company has $15 Bil in current market capitalization. Revenue over the last twelve months was $15 Bil, and it was operationally profitable with $759 Mil in operating profits and net income of $535 Mil. While a lot will depend on how results stack up against consensus and expectations, understanding historical patterns might just turn the odds in your favor if you are an event-driven trader. There are two ways to do that: understand the historical odds and position yourself prior to the earnings release, or look at the correlation between immediate and medium-term returns post earnings and position yourself accordingly after the earnings are released.
See earnings reaction history of all stocks
Casey’s General Stores’ Historical Odds Of Positive Post-Earnings Return
Some observations on one-day (1D) post-earnings returns:
- There are 19 earnings data points recorded over the last five years, with 6 positive and 13 negative one-day (1D) returns observed. In summary, positive 1D returns were seen about 32% of the time.
- Notably, this percentage increases to 45% if we consider data for the last 3 years instead of 5.
- Median of the 6 positive returns = 7.6%, and median of the 13 negative returns =-2.9%
Additional data for observed 5-Day (5D), and 21-Day (21D) returns post earnings are summarized along with the statistics in the table below.

CASY 1D, 5D, and 21D returns post earnings
Correlation Between 1D, 5D, and 21D Historical Returns
A relatively less risky strategy (though not useful if the correlation is low) is to understand the correlation between short-term and medium-term returns post earnings, find a pair that has the highest correlation, and execute the appropriate trade. For example, if 1D and 5D show the highest correlation, a trader can position themselves “long” for the next 5 days if 1D post-earnings return is positive. Here is some correlation data based on 5-year and 3-year (more recent) history. Note that the correlation 1D_5D refers to the correlation between 1D post-earnings returns and subsequent 5D returns.

CASY Correlation Between 1D, 5D and 21D Historical Returns
Is There Any Correlation With Peer Earnings?
Sometimes, peer performance can have influence on post-earnings stock reaction. In fact, the pricing-in might begin before the earnings are announced. Here is some historical data on the past post-earnings performance of Casey’s General Stores stock compared with the stock performance of peers that reported earnings just before Casey’s General Stores. For fair comparison, peer stock returns also represent post-earnings one-day (1D) returns.
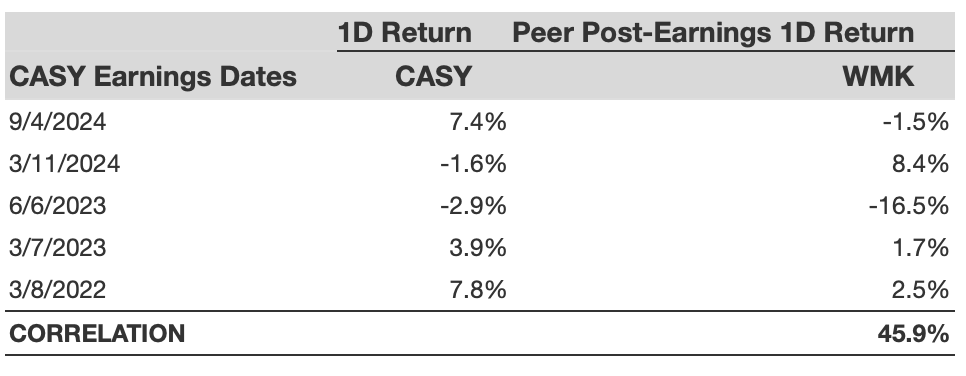
CASY Correlation With Peer Earnings
Systematic Strategies & Rules-Based Wealth Management
Trefis runs systematic portfolio strategies that incorporate risk control through a combination of high-quality picks and active hedges. We’ve partnered with Empirical Asset Management, a rules-based wealth manager, to make these strategies available to investors. If you’re interested in learning more about Trefis strategies or Empirical check out this link.