Hasbro (HAS)
Market Price (7/30/2026): $94.02 | Market Cap: $13.2 BilInvestor Relations Sector: Consumer Discretionary | Industry: Leisure Products
Hasbro (HAS)
Market Price (7/30/2026): $94.02Market Cap: $13.2 BilSector: Consumer DiscretionaryIndustry: Leisure Products
Investment Highlights Why It Matters Detailed financial logic regarding cash flow yields vs trend-riding momentum.
Strong revenue growthRev Chg LTMRevenue Change % Last Twelve Months (LTM) is 13% Attractive operating marginsOp Mgn LTMOperating Margin = Operating Income / Revenue Reflects profitability before taxes and before impact of capital structure (interest payments). is 24% Attractive cash flow generationCFO/Rev LTMCash Flow from Operations / Revenue (Sales), Last Twelve Months (LTM) is 23%, FCF/Rev LTMFree Cash Flow / Revenue (Sales), Last Twelve Months (LTM) is 18% Attractive yieldDividend Yield is 2.9%, FCF Yield is 6.6% Low stock price volatilityVol 12M is 30% Megatrend and thematic driversMegatrends include E-commerce & Digital Retail, Experience Economy & Premiumization, and Digital Content & Streaming. Themes include Direct-to-Consumer Brands, Show more. | Expensive valuation multiplesP/EBITPrice/EBIT or Price/(Operating Income) ratio is 79x Weak revenue growthRev Chg 3Y AvgRevenue Change % averaged over trailing 3 years is -4.6% Yield minus risk free rate is negativeERPEquity Risk Premium (ERP) = Total Yield - Risk Free Rate, Reflects the premium above risk free assets offered by the investment. is -3.1% Key risksHAS key risks include [1] its significant supply chain dependence on China, Show more. |
| Strong revenue growthRev Chg LTMRevenue Change % Last Twelve Months (LTM) is 13% |
| Attractive operating marginsOp Mgn LTMOperating Margin = Operating Income / Revenue Reflects profitability before taxes and before impact of capital structure (interest payments). is 24% |
| Attractive cash flow generationCFO/Rev LTMCash Flow from Operations / Revenue (Sales), Last Twelve Months (LTM) is 23%, FCF/Rev LTMFree Cash Flow / Revenue (Sales), Last Twelve Months (LTM) is 18% |
| Attractive yieldDividend Yield is 2.9%, FCF Yield is 6.6% |
| Low stock price volatilityVol 12M is 30% |
| Megatrend and thematic driversMegatrends include E-commerce & Digital Retail, Experience Economy & Premiumization, and Digital Content & Streaming. Themes include Direct-to-Consumer Brands, Show more. |
| Expensive valuation multiplesP/EBITPrice/EBIT or Price/(Operating Income) ratio is 79x |
| Weak revenue growthRev Chg 3Y AvgRevenue Change % averaged over trailing 3 years is -4.6% |
| Yield minus risk free rate is negativeERPEquity Risk Premium (ERP) = Total Yield - Risk Free Rate, Reflects the premium above risk free assets offered by the investment. is -3.1% |
| Key risksHAS key risks include [1] its significant supply chain dependence on China, Show more. |
Qualitative Assessment
AI Analysis | Feedback
Hasbro (HAS) stock has gained about 5% since 3/31/2026 because of the following key factors:
1. Robust Fiscal Q2 2026 Earnings Beat Driven by Wizards of the Coast Performance.
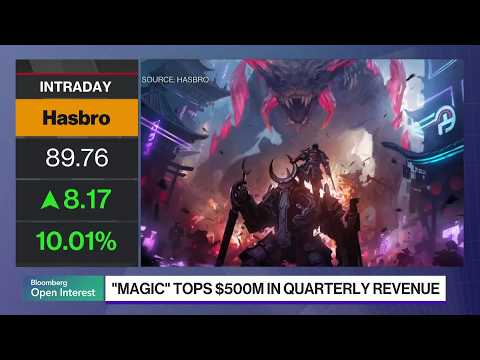
Hasbro reported stronger-than-expected financial results for fiscal Q2 2026 (ended June 28, 2026), with adjusted earnings per share of $1.28 and revenue of $1.14 billion, surpassing analyst consensus estimates of $1.13-$1.16 and $1.06-$1.07 billion, respectively. This outperformance was primarily fueled by the Wizards of the Coast and Digital Gaming segment, which saw its revenue increase by 27%, highlighted by Magic: The Gathering revenue growing 32% to exceed $500 million in a single quarter for the first time.
2. Increased Fiscal 2026 Full-Year Financial Guidance.
Following the strong second-quarter performance, Hasbro raised its full-year fiscal 2026 guidance. The company now anticipates total revenue growth of 5% to 7% in constant currency, an increase from its previous projection of 3% to 5%. Additionally, adjusted operating margin guidance was lifted to 25%-26% from 24%-25%, and adjusted EBITDA guidance was raised to a range of $1.45 billion to $1.50 billion, up from $1.40 billion to $1.45 billion.
Show more
Hasbro (HAS) stock has gained about 5% since 3/31/2026 because of the following key factors:
1. Robust Fiscal Q2 2026 Earnings Beat Driven by Wizards of the Coast Performance.
Hasbro reported stronger-than-expected financial results for fiscal Q2 2026 (ended June 28, 2026), with adjusted earnings per share of $1.28 and revenue of $1.14 billion, surpassing analyst consensus estimates of $1.13-$1.16 and $1.06-$1.07 billion, respectively. This outperformance was primarily fueled by the Wizards of the Coast and Digital Gaming segment, which saw its revenue increase by 27%, highlighted by Magic: The Gathering revenue growing 32% to exceed $500 million in a single quarter for the first time.
2. Increased Fiscal 2026 Full-Year Financial Guidance.
Following the strong second-quarter performance, Hasbro raised its full-year fiscal 2026 guidance. The company now anticipates total revenue growth of 5% to 7% in constant currency, an increase from its previous projection of 3% to 5%. Additionally, adjusted operating margin guidance was lifted to 25%-26% from 24%-25%, and adjusted EBITDA guidance was raised to a range of $1.45 billion to $1.50 billion, up from $1.40 billion to $1.45 billion.
3. Strategic Balance Sheet Management and Enhanced Shareholder Returns.
Hasbro continued to prioritize financial health and shareholder value during fiscal Q2 2026. The company deployed $55 million toward debt reduction in the quarter and increased its fiscal 2026 share repurchase target to a minimum of $200 million from the prior $100 million. Furthermore, Hasbro returned $133 million to shareholders through quarterly dividends and share repurchases.
4. Effective Digital Games Portfolio Refocus and Resilient Cyberattack Recovery.
Hasbro recorded a $56 million non-cash impairment charge in fiscal Q2 2026 related to a strategic refocusing of its Digital Games portfolio, canceling several upcoming titles to concentrate on fewer, higher-conviction projects for greater long-term efficiency and cost discipline. This strategic move was generally viewed positively by the market. Additionally, the estimated revenue impact from the unauthorized network access event in late March 2026 was $25 million, which was less severe than the initial projection of $40 million to $60 million, demonstrating the company's operational resilience.
Show less
Stock Movement Drivers
Fundamental Drivers
The 2.5% change in HAS stock from 3/31/2026 to 7/29/2026 was primarily driven by a 2.4% change in the company's Total Revenues ($ Mil).| (LTM values as of) | 3312026 | 7292026 | Change |
|---|---|---|---|
| Stock Price ($) | 92.84 | 95.17 | 2.5% |
| Change Contribution By: | |||
| Total Revenues ($ Mil) | 4,701 | 4,814 | 2.4% |
| P/S Multiple | 2.8 | 2.8 | 0.3% |
| Shares Outstanding (Mil) | 140 | 141 | -0.2% |
| Cumulative Contribution | 2.5% |
Market Drivers
3/31/2026 to 7/29/2026| Return | Correlation | |
|---|---|---|
| HAS | 2.5% | |
| Market (SPY) | 12.2% | 21.7% |
| Sector (XLY) | 2.4% | 21.0% |
Fundamental Drivers
The 17.8% change in HAS stock from 12/31/2025 to 7/29/2026 was primarily driven by a 10.5% change in the company's Total Revenues ($ Mil).| (LTM values as of) | 12312025 | 7292026 | Change |
|---|---|---|---|
| Stock Price ($) | 80.78 | 95.17 | 17.8% |
| Change Contribution By: | |||
| Total Revenues ($ Mil) | 4,357 | 4,814 | 10.5% |
| P/S Multiple | 2.6 | 2.8 | 6.9% |
| Shares Outstanding (Mil) | 140 | 141 | -0.3% |
| Cumulative Contribution | 17.8% |
Market Drivers
12/31/2025 to 7/29/2026| Return | Correlation | |
|---|---|---|
| HAS | 17.8% | |
| Market (SPY) | 7.3% | 30.5% |
| Sector (XLY) | -6.3% | 32.0% |
Fundamental Drivers
The 33.3% change in HAS stock from 6/30/2025 to 7/29/2026 was primarily driven by a 18.9% change in the company's P/S Multiple.| (LTM values as of) | 6302025 | 7292026 | Change |
|---|---|---|---|
| Stock Price ($) | 71.42 | 95.17 | 33.3% |
| Change Contribution By: | |||
| Total Revenues ($ Mil) | 4,265 | 4,814 | 12.9% |
| P/S Multiple | 2.3 | 2.8 | 18.9% |
| Shares Outstanding (Mil) | 140 | 141 | -0.7% |
| Cumulative Contribution | 33.3% |
Market Drivers
6/30/2025 to 7/29/2026| Return | Correlation | |
|---|---|---|
| HAS | 33.3% | |
| Market (SPY) | 19.1% | 36.4% |
| Sector (XLY) | 3.3% | 36.9% |
Fundamental Drivers
The 67.0% change in HAS stock from 6/30/2023 to 7/29/2026 was primarily driven by a 100.7% change in the company's P/S Multiple.| (LTM values as of) | 6302023 | 7292026 | Change |
|---|---|---|---|
| Stock Price ($) | 56.99 | 95.17 | 67.0% |
| Change Contribution By: | |||
| Total Revenues ($ Mil) | 5,695 | 4,814 | -15.5% |
| P/S Multiple | 1.4 | 2.8 | 100.7% |
| Shares Outstanding (Mil) | 139 | 141 | -1.6% |
| Cumulative Contribution | 67.0% |
Market Drivers
6/30/2023 to 7/29/2026| Return | Correlation | |
|---|---|---|
| HAS | 67.0% | |
| Market (SPY) | 70.4% | 42.0% |
| Sector (XLY) | 34.4% | 40.0% |
Price Returns Compared
| 2021 | 2022 | 2023 | 2024 | 2025 | 2026 | Total [1] | |
|---|---|---|---|---|---|---|---|
| Returns | |||||||
| HAS Return | 12% | -38% | -12% | 15% | 53% | 19% | 28% |
| Peers Return | 7% | -36% | 28% | 13% | 27% | -15% | 6% |
| S&P 500 Return | 27% | -19% | 24% | 23% | 16% | 9% | 98% |
Monthly Win Rates [3] | |||||||
| HAS Win Rate | 67% | 33% | 58% | 58% | 75% | 57% | |
| Peers Win Rate | 45% | 33% | 58% | 53% | 55% | 37% | |
| S&P 500 Win Rate | 75% | 42% | 67% | 75% | 67% | 43% | |
Max Drawdowns [4] | |||||||
| HAS Max Drawdown | -16% | -45% | -40% | -23% | -26% | -27% | |
| Peers Max Drawdown | -25% | -46% | -26% | -23% | -27% | -29% | |
| S&P 500 Max Drawdown | -5% | -25% | -10% | -8% | -19% | -9% | |
[1] Cumulative total returns since the beginning of 2021
[2] Peers: MAT, EA, TTWO, DIS, RBLX. See HAS Returns vs. Peers.
[3] Win Rate = % of calendar months in which monthly returns were positive
[4] Max drawdown represents maximum peak-to-trough decline within a year
[5] 2026 data is for the year up to 7/29/2026 (YTD)
How Low Can It Go
| Event | HAS | S&P 500 |
|---|---|---|
| 2025 US Tariff Shock | ||
| % Loss | -16.2% | -18.8% |
| % Gain to Breakeven | 19.3% | 23.1% |
| Time to Breakeven | 17 days | 79 days |
| Summer-Fall 2023 Five Percent Yield Shock | ||
| % Loss | -30.8% | -9.5% |
| % Gain to Breakeven | 44.5% | 10.5% |
| Time to Breakeven | 163 days | 24 days |
| 2023 SVB Regional Banking Crisis | ||
| % Loss | -19.7% | -6.7% |
| % Gain to Breakeven | 24.5% | 7.1% |
| Time to Breakeven | 44 days | 31 days |
| 2022 Inflation Shock & Fed Tightening | ||
| % Loss | -35.7% | -24.5% |
| % Gain to Breakeven | 55.6% | 32.4% |
| Time to Breakeven | 1174 days | 427 days |
| 2020 COVID-19 Crash | ||
| % Loss | -54.2% | -33.7% |
| % Gain to Breakeven | 118.4% | 50.9% |
| Time to Breakeven | 260 days | 140 days |
| Q4 2018 Fed Policy Error / Growth Scare | ||
| % Loss | -24.2% | -19.2% |
| % Gain to Breakeven | 32.0% | 23.8% |
| Time to Breakeven | 111 days | 105 days |
In The Past
Hasbro's stock fell -16.2% during the 2025 US Tariff Shock. Such a loss loss requires a 19.3% gain to breakeven.
Preserve Wealth
Limiting losses and compounding gains is essential to preserving wealth.
Asset Allocation
Actively managed asset allocation strategies protect wealth. Learn more.
| Event | HAS | S&P 500 |
|---|---|---|
| Summer-Fall 2023 Five Percent Yield Shock | ||
| % Loss | -30.8% | -9.5% |
| % Gain to Breakeven | 44.5% | 10.5% |
| Time to Breakeven | 163 days | 24 days |
| 2022 Inflation Shock & Fed Tightening | ||
| % Loss | -35.7% | -24.5% |
| % Gain to Breakeven | 55.6% | 32.4% |
| Time to Breakeven | 1174 days | 427 days |
| 2020 COVID-19 Crash | ||
| % Loss | -54.2% | -33.7% |
| % Gain to Breakeven | 118.4% | 50.9% |
| Time to Breakeven | 260 days | 140 days |
| Q4 2018 Fed Policy Error / Growth Scare | ||
| % Loss | -24.2% | -19.2% |
| % Gain to Breakeven | 32.0% | 23.8% |
| Time to Breakeven | 111 days | 105 days |
| 2011 US Debt Ceiling Crisis & European Contagion | ||
| % Loss | -20.4% | -17.9% |
| % Gain to Breakeven | 25.6% | 21.8% |
| Time to Breakeven | 345 days | 123 days |
In The Past
Hasbro's stock fell -16.2% during the 2025 US Tariff Shock. Such a loss loss requires a 19.3% gain to breakeven.
Preserve Wealth
Limiting losses and compounding gains is essential to preserving wealth.
Asset Allocation
Actively managed asset allocation strategies protect wealth. Learn more.
About Hasbro (HAS)
Hasbro, Inc. is a global play and entertainment company that designs, markets, and sells a wide array of branded consumer products and experiences. The company leverages its extensive portfolio of iconic brands and licensed intellectual properties to engage consumers across various segments of the entertainment industry.
Its primary offerings include a robust Consumer Products segment, which develops and sells physical toys and games such as action figures, dolls, arts and crafts, preschool toys, and traditional board games. Through its Wizards of the Coast and Digital Gaming segment, Hasbro creates popular trading card games, role-playing games, and digital game experiences based on its brands. Additionally, its Entertainment segment develops, produces, and distributes film, television, and digital content, extending its brand reach into various media formats.
Hasbro distributes its products globally through a diverse network, selling to major retailers, discount stores, department stores, and e-commerce platforms. The company also engages directly with consumers via its Hasbro PULSE e-commerce website, ensuring broad access for its extensive range of toys, games, and entertainment offerings.
AI Analysis | Feedback
- Like Disney, but focused on physical toys, board games, and fantasy intellectual property such as Dungeons & Dragons and Magic: The Gathering.
- Imagine Mattel meets a major gaming company (Wizards of the Coast) and a film studio.
AI Analysis | Feedback
- Toys and Games: Hasbro manufactures and sells a wide range of physical toy products, including action figures, dolls, play sets, preschool toys, blasters, and traditional board and card games.
- Licensed Consumer Products: The company out-licenses its trademarks, characters, and intellectual property rights to third parties for the sale of branded consumer products like apparel, publishing materials, and home goods.
- Wizards of the Coast and Digital Games: This segment develops and promotes trading card games, role-playing games, and digital game experiences based on Hasbro and Wizards of the Coast brands.
- Entertainment Content: Hasbro engages in the development, production, and distribution of diverse entertainment content, including film, scripted and unscripted television, and digital programming.
AI Analysis | Feedback
Hasbro (HAS) primarily sells its products to other companies, which then distribute and sell them to individual consumers. Based on the company description, Hasbro sells to a variety of retailers, distributors, and wholesalers.
Its major customers, representing various categories mentioned in the company description (retailers, discount stores, department stores, and e-commerce retailers), include:
- Walmart Inc. (WMT) - A major discount store and general merchandise retailer.
- Target Corporation (TGT) - A prominent general merchandise and discount store retailer.
- Amazon.com, Inc. (AMZN) - A dominant e-commerce retailer.
AI Analysis | Feedback
AI Analysis | Feedback
Chris Cocks
Chief Executive Officer and Board Member
Chris Cocks became the Chief Executive Officer of Hasbro in February 2022 and is also a Board member. He joined Hasbro in 2016 as President of the Wizards of the Coast and Digital Gaming segment, where he significantly grew brands like Magic: The Gathering and Dungeons & Dragons. Prior to his tenure at Hasbro, Mr. Cocks held senior management positions at Microsoft Corporation, where he was involved in marketing strategies for Xbox Games franchises and served as Vice President of OEM Technical Sales. He also worked at LeapFrog as Vice President of Educational Games and started his career in brand management at Procter & Gamble.
Gina Goetter
Chief Financial Officer and Chief Operating Officer
Gina Goetter was appointed Hasbro's Chief Financial Officer and Chief Operating Officer, effective May 18, 2023. In this dual role, she oversees global finance and operations, including treasury, tax, investor relations, accounting, and supply chain. Ms. Goetter brings over 25 years of experience in finance and accounting. Before joining Hasbro, she served as Chief Financial Officer for Harley-Davidson from 2020, where she led a multi-year strategic transformation to restore growth and profitability. Her background also includes serving as Senior Vice President of Finance for Tyson Foods' Prepared Foods Segment and 21 years in various finance leadership roles at General Mills.
Tim Kilpin
President, Toy, Licensing & Entertainment
Tim Kilpin joined Hasbro as President, Toy, Licensing & Entertainment, effective April 24, 2023. He is responsible for overseeing Hasbro's Consumer Products Group, focusing on the value and performance of the company's strategic franchise brands. Mr. Kilpin has extensive experience in the consumer products industry. Before Hasbro, he was the Executive Chairman (since January 2023) and CEO (from January 2022) of PlayMonster Group LLC. His previous roles include leading Activision Blizzard's Consumer Products business, serving as Chief Commercial Officer for Mattel, Inc., and as Executive Vice-President, Franchise Management at The Walt Disney Company.
John Hight
President of Wizards of the Coast and Digital Gaming
John Hight joined Hasbro as President of Wizards of the Coast and Digital Gaming on July 18, 2024. He is a recognized figure in the gaming industry. Prior to Hasbro, Mr. Hight spent 12 years at Blizzard Entertainment, where he most recently served as Senior Vice President and General Manager of the Warcraft Franchise. In that role, he oversaw all development and commercial activities for World of Warcraft, Hearthstone, and Warcraft Rumble, and directed development efforts for multiple World of Warcraft expansions and Diablo III titles.
Olivier Dumont
President of Hasbro Entertainment
Olivier Dumont leads the Hasbro Entertainment division as its President, a position announced in August 2023. This division focuses on developing and producing premium content across various platforms utilizing Hasbro's valuable brands. Mr. Dumont's role involves overseeing film, television, animation, and digital media expertise, a strategic move following Hasbro's sale of eOne's film & television business.
AI Analysis | Feedback
The public company Hasbro (HAS) faces several key risks to its business, primarily stemming from its segment concentration, susceptibility to economic fluctuations, and global operational dependencies.
-
Over-reliance on the Wizards of the Coast and Digital Gaming Segment: Hasbro's profitability is significantly concentrated in its Wizards of the Coast and Digital Gaming segment, particularly driven by the success of Magic: The Gathering. This segment is projected to account for a substantial portion of the company's profit. A misstep in this segment, such as an underperforming game release or a shortfall in a major digital game launch, could immediately and severely impact Hasbro's overall financial performance.
-
Adverse Economic Conditions, Consumer Spending Volatility, and High Indebtedness: Hasbro's business is vulnerable to changes in global economic conditions, including inflation, rising interest rates, and unemployment. Such factors can reduce discretionary consumer spending on toys and entertainment, directly harming the company's revenues and profitability. Compounding this, Hasbro carries a significant amount of long-term debt, which could limit its financial flexibility, divert cash to service debt payments, and increase interest expenses, especially during periods of economic downturn or rising interest rates.
-
Supply Chain Disruptions and Reliance on Third-Party Manufacturers: Hasbro heavily relies on third-party manufacturers, predominantly located in countries like China, Vietnam, and India, for the production of its toys and games. This dependence exposes the company to risks from global supply chain disruptions, geopolitical tensions, and increased logistics costs. Public health crises, such as the COVID-19 pandemic, have previously demonstrated Hasbro's vulnerability to operational and supply chain challenges, leading to increased costs and sales delays.
AI Analysis | Feedback
The accelerating shift in children's play patterns towards digital entertainment platforms and experiences, including increasing engagement with tablets, smartphones, video games (such as open-world/social platforms like Roblox and Minecraft), and streaming content, directly competes for the attention and playtime traditionally allocated to Hasbro's core physical toys and games within its Consumer Products segment.
AI Analysis | Feedback
Addressable Markets for Hasbro's Main Products and Services
-
Toys and Games Market (Global)
The global toys and games market size was estimated at approximately USD 357.59 billion in 2025 and is projected to reach USD 489.30 billion by 2033, demonstrating a compound annual growth rate (CAGR) of 3.9% from 2026 to 2033. Other estimates value the market at USD 324.5 billion or around USD 354.7 billion in 2025, growing to USD 532.1 billion by 2033 at a CAGR of 5.2%. This market is driven by factors such as increasing disposable income, demand for educational and interactive toys, and the expansion of e-commerce platforms.
Asia Pacific is a dominant region in the global toys and games market, holding a significant share (e.g., 35.4% in 2025 or 40.03% in 2025), due to a large youth population and growing middle-class purchasing power.
-
Trading Card Game (TCG) Market (Global)
The global trading card game market is projected to grow from approximately USD 7.85 billion in 2025 to USD 12.86 billion by 2031, with a CAGR of 8.57%. Another source states the market was worth around USD 7.43 billion in 2024 and is predicted to grow to around USD 15.84 billion by 2034, at a CAGR of roughly 7.86% between 2025 and 2034. The market was also valued at USD 7.51 billion in 2025 and is estimated to grow to USD 11.47 billion by 2031 with a CAGR of 7.30%.
North America is a significant region within the TCG market, expected to account for more than 40% of the market share in 2024. Character cards held a 44.60% market share in the trading card game market in 2025.
-
Tabletop Role-Playing Game (TTRPG) Market (Global)
The global Tabletop Role-Playing Game (TTRPG) market was valued at approximately USD 2.15 billion in 2025 and is expected to reach nearly USD 6.59 billion by 2035, growing at a CAGR of 11.84% during this period. Another estimate places the market size at USD 2.3 billion in 2026, projected to reach USD 6.32 billion by 2035 at a CAGR of 11.88%. The market was estimated around USD 1.9–2.0 billion in 2024.
North America is projected to command the largest share of the global TTRPG market, accounting for approximately 38–42% throughout 2026–2035. Wizards of the Coast, a Hasbro subsidiary, held a 56.44% share of the TTRPG market in 2023.
-
IP-Based Mobile Games Market (Global)
The global IP-Based Mobile Games Market was estimated at USD 18.07 billion in 2025 and is expected to reach USD 19.52 billion in 2026, with a CAGR of 7.53% to reach USD 30.05 billion by 2032. This market is driven by collaborations between licensors and developers and the proliferation of smartphones.
AI Analysis | Feedback
Hasbro (NASDAQ: HAS) anticipates several key drivers to fuel its revenue growth over the next two to three years, primarily through its "Playing to Win" strategic plan. These drivers focus on leveraging its strong brand portfolio, expanding its digital footprint, and strategic partnerships.
Here are the expected drivers of future revenue growth for Hasbro:
- Continued Growth in Wizards of the Coast and Digital Gaming: This segment, encompassing popular franchises like Magic: The Gathering and licensed digital games such as Baldur's Gate III and Monopoly Go!, is a consistent and strong performer for Hasbro. The company expects mid-single-digit revenue growth from this segment, driven by a robust pipeline of new releases and expanding engagement for the Magic brand, including "Universes Beyond" collaborations.
- Strategic Reinvention and Expansion of Core Consumer Products Brands: Hasbro is focused on a return to growth for its Consumer Products segment, emphasizing innovation and strategic licensing partnerships. This includes a strong lineup of toys and games for core brands like MONOPOLY, PEPPA PIG, TRANSFORMERS, Marvel, and Play-Doh. The company aims to broaden its appeal to older demographics (fans aged 13 and above), expand in girls' toys, and grow in emerging markets.
- Broadening Fan Reach and Enhancing Digital and Direct-to-Consumer Capabilities: Hasbro plans to significantly expand its global fan base from over 500 million to more than 750 million by 2027. This growth will be achieved through "play-fueled engagement and partner-scaled co-investment," alongside efforts to meet fans in their preferred playing environments, which are increasingly online, and by strengthening its digital and direct-to-consumer (DTC) channels.
- Asset-Light, Partner-Led Entertainment Strategy: Following the divestiture of eOne Film and TV, Hasbro is shifting to an asset-light, partner-led model for its Entertainment segment. This strategy focuses on maximizing the value of its intellectual property through licensing agreements for content and consumer products, rather than direct production. This approach is expected to generate profitable revenue through expanded brand reach via retail and licensing partnerships, including a strong entertainment slate from its Disney partnership.
AI Analysis | Feedback
Share Repurchases
- Hasbro announced a new $1 billion share repurchase program in February 2026, replacing a previous 2018 authorization.
- In 2022, Hasbro conducted net common equity repurchases totaling $125 million.
- No significant net share repurchases were reported for 2023 and 2024.
Share Issuance
- Hasbro did not report any significant dollar amount of net share issuances in 2023 and 2024.
Outbound Investments
- Hasbro divested its eOne Music business in 2021.
- In April 2022, Hasbro acquired D&D Beyond for $146 million.
- Hasbro sold its eOne film and TV business to Lionsgate for $500 million in December 2023, which contributed to reducing debt.
Capital Expenditures
- Hasbro's capital expenditures were $132.7 million in 2021, $174.2 million in 2022, $209.3 million in 2023, and $197.5 million in 2024.
- Expected capital expenditures for 2025 are $198.3 million and for 2026 are $250.5 million.
- The primary focus of capital expenditures includes investments in digital games, particularly AAA and AA titles, and enhancing toy business infrastructure, supply chain resilience, and AI integration.
Latest Trefis Analyses
Research & Analysis
Invest in Strategies
Wealth Management
Peer Comparisons
| Peers to compare with: |
Financials
| Median | |
|---|---|
| Name | |
| Mkt Price | 96.83 |
| Mkt Cap | 40.7 |
| Rev LTM | 6,020 |
| Op Inc LTM | 827 |
| FCF LTM | 1,205 |
| FCF 3Y Avg | 791 |
| CFO LTM | 1,537 |
| CFO 3Y Avg | 1,041 |
Growth & Margins
| Median | |
|---|---|
| Name | |
| Rev Chg LTM | 8.2% |
| Rev Chg 3Y Avg | 2.5% |
| Rev Chg Q | 9.2% |
| QoQ Delta Rev Chg LTM | 2.0% |
| Op Inc Chg LTM | -11.6% |
| Op Inc Chg 3Y Avg | 15.6% |
| Op Mgn LTM | 12.0% |
| Op Mgn 3Y Avg | 12.5% |
| QoQ Delta Op Mgn LTM | 1.1% |
| CFO/Rev LTM | 19.5% |
| CFO/Rev 3Y Avg | 18.2% |
| FCF/Rev LTM | 12.9% |
| FCF/Rev 3Y Avg | 13.4% |
Valuation
| Median | |
|---|---|
| Name | |
| Mkt Cap | 40.7 |
| P/S | 4.8 |
| P/Op Inc | 10.3 |
| P/EBIT | 9.5 |
| P/E | -11.7 |
| P/CFO | 15.1 |
| Total Yield | 1.7% |
| Dividend Yield | 0.2% |
| FCF Yield 3Y Avg | 4.7% |
| D/E | 0.2 |
| Net D/E | 0.1 |
Returns
| Median | |
|---|---|
| Name | |
| 1M Rtn | 1.2% |
| 3M Rtn | 2.6% |
| 6M Rtn | -4.0% |
| 12M Rtn | -0.8% |
| 3Y Rtn | 41.3% |
| 1M Excs Rtn | 2.9% |
| 3M Excs Rtn | -0.6% |
| 6M Excs Rtn | -9.8% |
| 12M Excs Rtn | -16.5% |
| 3Y Excs Rtn | -20.3% |
Comparison Analyses
Segment Financials
Revenue by Segment| $ Mil | 2025 | 2024 | 2023 | 2022 | 2021 |
|---|---|---|---|---|---|
| Consumer Products | 2,438 | 2,786 | 3,171 | 3,572 | 3,982 |
| Wizards of the Coast and Digital Gaming | 2,187 | 1,666 | 1,641 | 1,325 | 1,287 |
| Entertainment | 77 | 133 | 711 | 959 | 1,152 |
| Corporate and Other | 0 | 161 | 187 | ||
| Intersegment revenue | -610 | -707 | |||
| Total | 4,701 | 4,136 | 5,003 | 5,857 | 6,420 |
| $ Mil | 2025 | 2024 | 2023 | 2022 | 2021 |
|---|---|---|---|---|---|
| Wizards of the Coast and Digital Gaming | 1,007 | 632 | 526 | 538 | 547 |
| Entertainment | 0 | -2 | -1,912 | 23 | -92 |
| Corporate and Other | -54 | -56 | -88 | -371 | -93 |
| Consumer Products | -943 | 115 | -65 | 217 | 401 |
| Total | 11 | 690 | -1,539 | 408 | 763 |
| $ Mil | 2024 | 2023 | 2022 | 2021 |
|---|---|---|---|---|
| Consumer Products | 7,785 | 6,456 | 5,758 | 4,926 |
| Wizards of the Coast and Digital Gaming | 5,778 | 4,340 | 2,969 | 1,585 |
| Entertainment | 2,858 | 3,508 | 6,273 | 6,053 |
| Corporate and Other | -10,081 | -7,764 | -5,704 | -2,526 |
| Total | 6,340 | 6,541 | 9,296 | 10,038 |
Price Behavior
| Market Price | $95.17 | |
| Market Cap ($ Bil) | 13.4 | |
| First Trading Date | 12/18/1984 | |
| Distance from 52W High | -8.8% | |
| 50 Days | 200 Days | |
| DMA Price | $84.67 | $86.27 |
| DMA Trend | up | down |
| Distance from DMA | 12.4% | 10.3% |
| 3M | 1YR | |
| Volatility | 37.0% | 30.5% |
| Downside Capture | 62.34 | 71.57 |
| Upside Capture | 64.47 | 89.21 |
| Correlation (SPY) | 16.9% | 36.8% |
| 1M | 2M | 3M | 6M | 1Y | 3Y | |
|---|---|---|---|---|---|---|
| Beta | 0.47 | 0.20 | 0.69 | 0.72 | 0.84 | 0.91 |
| Up Beta | 0.53 | 0.57 | 1.64 | 1.09 | 1.18 | 0.92 |
| Down Beta | 0.83 | 0.50 | 0.42 | 1.00 | 1.01 | 1.07 |
| Up Capture | 13% | -48% | 1% | 39% | 57% | 56% |
| Bmk +ve Days | 11 | 24 | 40 | 67 | 140 | 429 |
| Stock +ve Days | 10 | 16 | 27 | 54 | 121 | 378 |
| Down Capture | 49% | 43% | 54% | 57% | 71% | 95% |
| Bmk -ve Days | 10 | 17 | 23 | 58 | 112 | 321 |
| Stock -ve Days | 11 | 24 | 35 | 70 | 129 | 370 |
[1] Upside and downside betas calculated using positive and negative benchmark daily returns respectively
Based On 1-Year Data
| Annualized Return | Annualized Volatility | Sharpe Ratio | Correlation with HAS | |
|---|---|---|---|---|
| HAS | 29.1% | 30.4% | 0.85 | - |
| Sector ETF (XLY) | -0.7% | 19.3% | -0.16 | 36.4% |
| Equity (SPY) | 15.6% | 12.8% | 0.86 | 36.9% |
| Gold (GLD) | 21.6% | 28.1% | 0.68 | 8.5% |
| Commodities (DBC) | 31.5% | 19.7% | 1.27 | -10.3% |
| Real Estate (VNQ) | 15.9% | 14.0% | 0.82 | 31.1% |
| Bitcoin (BTCUSD) | -46.1% | 42.9% | -1.32 | 11.0% |
Smart multi-asset allocation framework can stack odds in your favor. Learn How
Based On 5-Year Data
| Annualized Return | Annualized Volatility | Sharpe Ratio | Correlation with HAS | |
|---|---|---|---|---|
| HAS | 4.3% | 33.3% | 0.18 | - |
| Sector ETF (XLY) | 5.1% | 24.0% | 0.18 | 46.7% |
| Equity (SPY) | 12.4% | 17.1% | 0.55 | 48.2% |
| Gold (GLD) | 17.1% | 18.4% | 0.75 | 5.2% |
| Commodities (DBC) | 9.3% | 19.5% | 0.36 | 8.2% |
| Real Estate (VNQ) | 2.9% | 18.9% | 0.05 | 43.1% |
| Bitcoin (BTCUSD) | 14.7% | 53.3% | 0.46 | 18.9% |
Smart multi-asset allocation framework can stack odds in your favor. Learn How
Based On 10-Year Data
| Annualized Return | Annualized Volatility | Sharpe Ratio | Correlation with HAS | |
|---|---|---|---|---|
| HAS | 5.1% | 34.0% | 0.23 | - |
| Sector ETF (XLY) | 11.8% | 22.1% | 0.49 | 50.5% |
| Equity (SPY) | 14.7% | 17.9% | 0.70 | 50.8% |
| Gold (GLD) | 11.3% | 16.1% | 0.57 | 4.5% |
| Commodities (DBC) | 7.1% | 18.0% | 0.32 | 14.9% |
| Real Estate (VNQ) | 5.1% | 20.7% | 0.21 | 44.0% |
| Bitcoin (BTCUSD) | 57.7% | 66.2% | 0.98 | 11.3% |
Smart multi-asset allocation framework can stack odds in your favor. Learn How
Returns Analyses
Earnings Returns History
Updated 7/30/2026| Forward Returns | |||
|---|---|---|---|
| Earnings Date | 1D Returns | 5D Returns | 21D Returns |
| 7/21/2026 | 8.8% | 11.1% | |
| 5/20/2026 | -8.8% | -9.5% | -12.1% |
| 2/10/2026 | 7.5% | 5.7% | -1.9% |
| 10/23/2025 | 3.7% | 3.7% | 3.1% |
| 7/23/2025 | -0.9% | -1.6% | 3.6% |
| 4/24/2025 | 14.6% | 17.5% | 27.3% |
| 2/20/2025 | 13.0% | 11.3% | -0.2% |
| 10/24/2024 | -6.0% | -5.2% | -11.0% |
| ... | |||
| SUMMARY STATS | |||
| # Positive | 14 | 15 | 14 |
| # Negative | 11 | 10 | 10 |
| Median Positive | 6.3% | 7.2% | 5.4% |
| Median Negative | -6.0% | -5.3% | -8.6% |
| Max Positive | 14.6% | 17.6% | 27.3% |
| Max Negative | -11.7% | -14.6% | -14.4% |
| Forward Returns | |||
|---|---|---|---|
| Earnings Date | 1D Returns | 5D Returns | 21D Returns |
| 7/21/2026 | 8.8% | 11.1% | |
| 5/20/2026 | -8.8% | -9.5% | -12.1% |
| 2/10/2026 | 7.5% | 5.7% | -1.9% |
| 10/23/2025 | 3.7% | 3.7% | 3.1% |
| 7/23/2025 | -0.9% | -1.6% | 3.6% |
| 4/24/2025 | 14.6% | 17.5% | 27.3% |
| 2/20/2025 | 13.0% | 11.3% | -0.2% |
| 10/24/2024 | -6.0% | -5.2% | -11.0% |
| 7/25/2024 | 3.5% | 8.5% | 13.7% |
| 4/24/2024 | 11.9% | 6.6% | 4.9% |
| 2/13/2024 | -1.3% | -2.1% | 3.4% |
| 10/26/2023 | -11.7% | -14.6% | -14.4% |
| 8/3/2023 | 1.1% | 2.6% | 11.9% |
| 4/27/2023 | 14.6% | 17.6% | 17.6% |
| 1/27/2023 | -8.1% | 0.4% | -12.3% |
| 10/18/2022 | -2.9% | -3.1% | -12.4% |
| 7/19/2022 | 0.7% | -1.0% | 4.7% |
| 4/19/2022 | 5.2% | 7.2% | 11.7% |
| 2/7/2022 | -1.0% | 0.5% | -6.2% |
| 10/26/2021 | 3.2% | 8.0% | 13.2% |
| 7/26/2021 | 12.2% | 8.3% | 5.9% |
| 4/27/2021 | 1.4% | 3.1% | -2.4% |
| 2/8/2021 | -4.2% | -6.0% | -1.5% |
| 10/26/2020 | -9.3% | -9.4% | 1.5% |
| 7/27/2020 | -7.4% | -5.3% | 4.0% |
| SUMMARY STATS | |||
| # Positive | 14 | 15 | 14 |
| # Negative | 11 | 10 | 10 |
| Median Positive | 6.3% | 7.2% | 5.4% |
| Median Negative | -6.0% | -5.3% | -8.6% |
| Max Positive | 14.6% | 17.6% | 27.3% |
| Max Negative | -11.7% | -14.6% | -14.4% |
SEC Filings
Expand for More| Report Date | Filing Date | Filing |
|---|---|---|
| 03/31/2026 | 05/13/2026 | 10-Q |
| 12/31/2025 | 02/25/2026 | 10-K |
| 09/30/2025 | 11/05/2025 | 10-Q |
| 06/30/2025 | 07/31/2025 | 10-Q |
| 03/31/2025 | 05/06/2025 | 10-Q |
| 12/31/2024 | 02/27/2025 | 10-K |
| 09/30/2024 | 10/31/2024 | 10-Q |
| 06/30/2024 | 07/31/2024 | 10-Q |
| 03/31/2024 | 05/01/2024 | 10-Q |
| 12/31/2023 | 02/28/2024 | 10-K |
| 09/30/2023 | 11/01/2023 | 10-Q |
| 06/30/2023 | 08/04/2023 | 10-Q |
| 03/31/2023 | 05/03/2023 | 10-Q |
| 12/31/2022 | 02/22/2023 | 10-K |
| 09/30/2022 | 10/26/2022 | 10-Q |
| 06/30/2022 | 07/26/2022 | 10-Q |
| Report Date | Filing Date | Filing |
|---|---|---|
| 03/31/2026 | 05/13/2026 | 10-Q |
| 12/31/2025 | 02/25/2026 | 10-K |
| 09/30/2025 | 11/05/2025 | 10-Q |
| 06/30/2025 | 07/31/2025 | 10-Q |
| 03/31/2025 | 05/06/2025 | 10-Q |
| 12/31/2024 | 02/27/2025 | 10-K |
| 09/30/2024 | 10/31/2024 | 10-Q |
| 06/30/2024 | 07/31/2024 | 10-Q |
| 03/31/2024 | 05/01/2024 | 10-Q |
| 12/31/2023 | 02/28/2024 | 10-K |
| 09/30/2023 | 11/01/2023 | 10-Q |
| 06/30/2023 | 08/04/2023 | 10-Q |
| 03/31/2023 | 05/03/2023 | 10-Q |
| 12/31/2022 | 02/22/2023 | 10-K |
| 09/30/2022 | 10/26/2022 | 10-Q |
| 06/30/2022 | 07/26/2022 | 10-Q |
| 03/31/2022 | 04/27/2022 | 10-Q |
| 12/31/2021 | 02/23/2022 | 10-K |
| 09/30/2021 | 10/27/2021 | 10-Q |
| 06/30/2021 | 07/28/2021 | 10-Q |
| 03/31/2021 | 04/29/2021 | 10-Q |
| 12/31/2020 | 02/24/2021 | 10-K |
| 09/30/2020 | 11/04/2020 | 10-Q |
| 06/30/2020 | 07/31/2020 | 10-Q |
| 03/31/2020 | 05/07/2020 | 10-Q |
| 12/31/2019 | 02/27/2020 | 10-K |
| 09/30/2019 | 10/22/2019 | 10-Q |
| 06/30/2019 | 07/31/2019 | 10-Q |
Recent Forward Guidance
Updated 7/22/2026Latest: Q2 2026 Earnings Reported 7/21/2026
| Forward Guidance | Guidance Change | ||||||
|---|---|---|---|---|---|---|---|
| Metric | Low | Mid | High | % Chg | % Delta | Change | Prior |
| 2026 Revenue Growth | 5.0% | 6.0% | 7.0% | 2.0% | Raised | Guidance: 4.0% for 2026 | |
| 2026 Adjusted Operating Margin | 25.0% | 25.5% | 26.0% | 1.0% | Raised | Guidance: 24.5% for 2026 | |
| 2026 Adjusted EBITDA | 1.45 Bil | 1.48 Bil | 1.50 Bil | 3.5% | Raised | Guidance: 1.43 Bil for 2026 | |
Prior: Q1 2026 Earnings Reported 4/23/2026
| Forward Guidance | Guidance Change | ||||||
|---|---|---|---|---|---|---|---|
| Metric | Low | Mid | High | % Chg | % Delta | Change | Prior |
| 2026 Revenue Growth | 3.0% | 4.0% | 5.0% | 0.0% | Affirmed | Guidance: 4.0% for 2026 | |
| 2026 Adjusted Operating Margin | 24.0% | 24.5% | 25.0% | 0.0% | Affirmed | Guidance: 24.5% for 2026 | |
| 2026 Adjusted EBITDA | 1.40 Bil | 1.43 Bil | 1.45 Bil | 0.0% | Affirmed | Guidance: 1.43 Bil for 2026 | |
Q4 2025 Earnings Reported 2/10/2026
| Forward Guidance | Guidance Change | ||||||
|---|---|---|---|---|---|---|---|
| Metric | Low | Mid | High | % Chg | % Delta | Change | Prior |
| 2026 Revenue Growth | 3.0% | 4.0% | 5.0% | ||||
| 2026 Adjusted Operating Margin | 24.0% | 24.5% | 25.0% | 2.0% | Higher New | Guidance: 22.5% for 2025 | |
| 2026 Adjusted EBITDA | 1.40 Bil | 1.43 Bil | 1.45 Bil | 14.0% | Higher New | Guidance: 1.25 Bil for 2025 | |
Q3 2025 Earnings Reported 10/23/2025
| Forward Guidance | Guidance Change | ||||||
|---|---|---|---|---|---|---|---|
| Metric | Low | Mid | High | % Chg | % Delta | Change | Prior |
| 2025 Revenue Growth | Raised | Guidance: 5.0% for 2025 | |||||
| 2025 Operating Margin | 22.0% | 22.5% | 23.0% | 0.0% | Affirmed | Guidance: 22.5% for 2025 | |
| 2025 Adjusted EBITDA | 1.24 Bil | 1.25 Bil | 1.26 Bil | 5.5% | Raised | Guidance: 1.19 Bil for 2025 | |
Insider Activity
Updated 7/29/2026| # | Owner | Title | Holding | Action | Filing Date | Price | Shares | Transacted Value | Value of Held Shares | Form |
|---|---|---|---|---|---|---|---|---|---|---|
| 1 | Goetter, Gina M | EVP & CFO | Direct | Sell | 7292026 | 95.44 | 11,000 | 1,049,895 | 8,409,086 | Form |
| 2 | Kilpin, Timothy J | President, Toy, Lic & Ent | Direct | Sell | 7282026 | 93.12 | 20,000 | 1,862,450 | 5,049,940 | Form |
| 3 | Cocks, Christian P | Chief Executive Officer | Direct | Sell | 3022026 | 100.33 | 196,411 | 19,706,037 | 30,431,279 | Form |
| 4 | Barbacovi, Holly | Chief People Officer | Direct | Sell | 2232026 | 100.97 | 4,337 | 437,929 | 4,316,984 | Form |
| 5 | Kilpin, Timothy J | President, Toy, Lic & Ent | Direct | Sell | 2172026 | 103.00 | 7,773 | 800,619 | 3,762,384 | Form |
| # | Owner | Title | Holding | Action | Filing Date | Price | Shares | Transacted Value | Value of Held Shares | Form |
|---|---|---|---|---|---|---|---|---|---|---|
| 1 | Goetter, Gina M | EVP & CFO | Direct | Sell | 7292026 | 95.44 | 11,000 | 1,049,895 | 8,409,086 | Form |
| 2 | Kilpin, Timothy J | President, Toy, Lic & Ent | Direct | Sell | 7282026 | 93.12 | 20,000 | 1,862,450 | 5,049,940 | Form |
| 3 | Cocks, Christian P | Chief Executive Officer | Direct | Sell | 3022026 | 100.33 | 196,411 | 19,706,037 | 30,431,279 | Form |
| 4 | Barbacovi, Holly | Chief People Officer | Direct | Sell | 2232026 | 100.97 | 4,337 | 437,929 | 4,316,984 | Form |
| 5 | Kilpin, Timothy J | President, Toy, Lic & Ent | Direct | Sell | 2172026 | 103.00 | 7,773 | 800,619 | 3,762,384 | Form |
| 6 | Cocks, Christian P | Chief Executive Officer | Direct | Sell | 2172026 | 103.86 | 181,581 | 18,859,028 | 25,950,598 | Form |
| 7 | Bunge, Jason M | Chief Marketing Officer | Direct | Sell | 2132026 | 106.03 | 2,380 | 252,342 | 3,711,437 | Form |
| 8 | Goetter, Gina M | EVP & CFO | Direct | Sell | 2132026 | 103.46 | 12,429 | 1,285,867 | 7,057,940 | Form |
| 9 | Sibley, Tarrant L | EVP, CLO and Corp Secretary | Direct | Sell | 2132026 | 104.98 | 15,148 | 1,590,186 | 5,267,093 | Form |
| 10 | Cochran, Hope F | Direct | Sell | 11122025 | 77.24 | 4,000 | 308,972 | 1,321,011 | Form | |
| 11 | Thomson, Roberta K | Chief Communications Officer | Direct | Sell | 8282025 | 81.13 | 2,500 | 202,825 | 3,959,225 | Form |
| 12 | Kilpin, Timothy J | President, Toy, Lic & Ent | Direct | Sell | 8272025 | 81.44 | 8,557 | 696,882 | 3,607,873 | Form |
| 13 | Cocks, Christian P | Chief Executive Officer | Direct | Sell | 8222025 | 78.92 | 27,800 | 2,194,073 | 19,719,899 | Form |
| 14 | Thomson, Roberta K | Chief Communications Officer | Direct | Sell | 8142025 | 79.81 | 1,002 | 79,971 | 4,094,405 | Form |
Investor Activity (13F)
Updated Jul 30, 2026Active managers (13F portfolio over $250M, at least 3 holdings) with a position over $5M that is either over 10% of their portfolio or held in a concentrated book of 50 or fewer total positions. Index/ETF, sovereign, bank, community-bank and charitable/donor-advised filers are excluded.

Industry Resources
| Consumer Discretionary Resources |
| Retail Dive |
| Business of Fashion (BoF) |
| WWD (Women's Wear Daily) |
| National Retail Federation (NRF) |
| McKinsey & Company - Consumer |
| Mintel Consumer Trends |
| Leisure Products Resources |
| The Toy Book |
| Bicycle Retailer |
| SGB Media |
External Quote Links
| Y Finance | Barrons |
| TradingView | Morningstar |
| SeekingAlpha | ValueLine |
| Motley Fool | Robinhood |
| CNBC | Etrade |
| MarketWatch | Unusual Whales |
| YCharts | Perplexity Finance |
| FinViz |
Prefer one of these to Trefis? Tell us why.