How Will Carnival Stock React To Its Upcoming Earnings?
Carnival (NYSE:CCL) is expected to report its earnings on Friday, March 21, 2025. The cruising giant is likely to report earnings of $0.02 per share per consensus estimates, up from a net loss in the year-ago quarter. The consensus estimate for revenues stands at $5.74 billion, up about 6% compared to the last year. Demand for leisure cruising has held up well with Carnival indicating that bookings for future trips have risen in recent quarters. The cruise line has also been witnessing growth in both passenger ticket revenue as well as onboard spending.
The company has $27 Bil in current market capitalization. Revenue over the last twelve months was $25 Bil, and it was operationally profitable with $3.6 Bil in operating profits and net income of $1.9 Bil. While a lot will depend on how results stack up against consensus and expectations, understanding historical patterns might just turn the odds in your favor if you are an event-driven trader.
There are two ways to do that: understand the historical odds and position yourself prior to the earnings release, or look at the correlation between immediate and medium-term returns post-earnings and position yourself accordingly after the earnings are released. That said, if you seek upside with lower volatility than individual stocks, the Trefis High-Quality portfolio presents an alternative – having outperformed the S&P 500 and generated returns exceeding 91% since its inception.
See earnings reaction history of all stocks
- Get Paid 8.6% to Buy GOOGL at a 30% Discount – Here’s How
- What Could Spark the Next Big Move In Netflix Stock
- Why Amazon.com Stock May Drop Soon
- Cash Rich, Low Price – Gartner Stock to Break Out?
- Does Johnson & Johnson Stock Have More Upside?
- Has American Water Works Stock Quietly Become a Value Opportunity?
Carnival’s Historical Odds Of Positive Post-Earnings Return
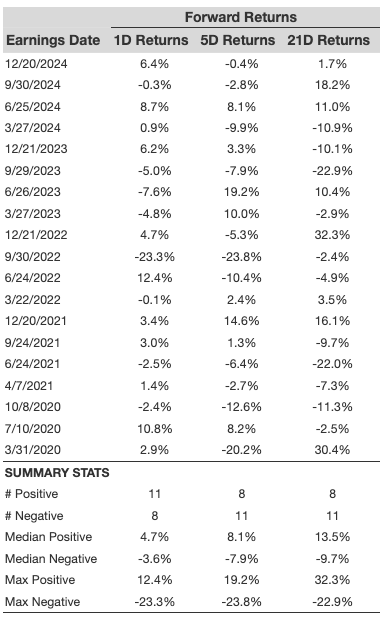
Some observations on one-day (1D) post-earnings returns:
- There are 19 earnings data points recorded over the last five years, with 11 positive and 8 negative one-day (1D) returns observed. In summary, positive 1D returns were seen about 58% of the time.
- However, this percentage decreases to 50% if we consider data for the last 3 years instead of 5.
- Median of the 11 positive returns = 4.7%, and median of the 8 negative returns =-3.6%
Additional data for observed 5-Day (5D), and 21-Day (21D) returns post earnings are summarized along with the statistics in the table below.
Correlation Between 1D, 5D, and 21D Historical Returns
A relatively less risky strategy (though not useful if the correlation is low) is to understand the correlation between short-term and medium-term returns post earnings, find a pair that has the highest correlation, and execute the appropriate trade. For example, if 1D and 5D show the highest correlation, a trader can position themselves “long” for the next 5 days if 1D post-earnings return is positive. Here is some correlation data based on 5-year and 3-year (more recent) history. Note that the correlation 1D_5D refers to the correlation between 1D post-earnings returns and subsequent 5D returns.

Systematic Strategies & Rules-Based Wealth Management
Trefis runs systematic portfolio strategies that incorporate risk control through a combination of high-quality picks and active hedges. We’ve partnered with Empirical Asset Management, a rules-based wealth manager, to make these strategies available to investors. If you’re interested in learning more about Trefis strategies or Empirical check out this link.